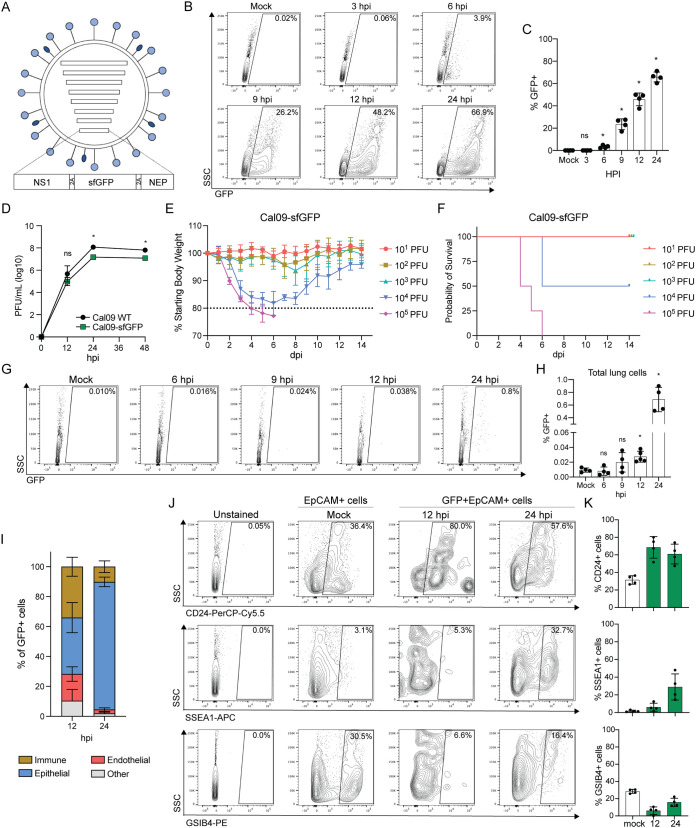
FIG 1.
Ciliated cells are a target of a Cal09 reporter virus in the murine upper respiratory tract. (A) Schematic of A/California/04/2009 reporter virus expressing sfGFP from segment 8, which also encodes nonstructural proteins NS1 and NEP. 2A, porcine teschovirus 2A sequence. (B) Representative flow cytometry of GFP+ cells collected at the indicated time points following infection with Cal09-sfGFP (MDCK cells, MOI = 0.5, single-cycle infection). hpi, hours postinfection. (C) Quantification of flow cytometry in panel B. Means with SDs are shown; n = 4 independent experiments; Mann-Whitney U test. (D) Viral titer after replication in embryonated chicken eggs for the time indicated for wild-type Cal09 or Cal09-sfGFP (1,000 PFU), measured using plaque assays. PFU, plaque-forming units. Means with SDs are shown; n = 4 eggs per sample; Mann-Whitney U test. (E) Body weights of mice infected with the indicated doses of Cal09-sfGFP. Means with SDs are shown; n = 4 to 6 mice per dose. Dashed line represents humane endpoint. dpi, days postinfection. (F) Kaplan-Meier survival curve of mice infected with the indicated doses of Cal09-sfGFP. n = 4 to 6 mice per dose. (G) Representative flow cytometry of GFP+ cells from the lungs of mice infected with Cal09-sfGFP at the indicated times postinfection. (H) Quantification of flow cytometry in panel G. Means with SDs are shown; n = 4 to 5 mice per time point; Mann-Whitney U test. (I) Quantification of GFP+ cell surface expression of CD45, EpCAM, or CD31. Immune cells, CD45+; epithelial cells, CD45-EpCAM+; endothelial, CD45-CD31+. Cells without expression of either three were categorized as “other.” Cells were isolated from tracheas of Cal09-sfGFP-infected mice at the indicated times postinfection. Means with SDs are shown; n = 4 mice per time point. (J) Representative flow cytometry of unstained, EpCAM+ (Mock) or GFP+ EpCAM+ (12 hpi, 24 hpi) cells isolated from the tracheas of mice infected with Cal09-sfGFP at the indicated times postinfection stained for surface expression of CD24 (ciliated cells), SSEA1 (secretory cells), and GSIB4 (basal cells). (K) Quantification of flow cytometry in panel J (EpCAM+ cells, white bars; GFP+ EpCAM+ cells, green bars). Means with SDs are shown; n = 4 mice per time point. For all panels, ns, not significant, and *, P ≤ 0.05.

