FIG 2.
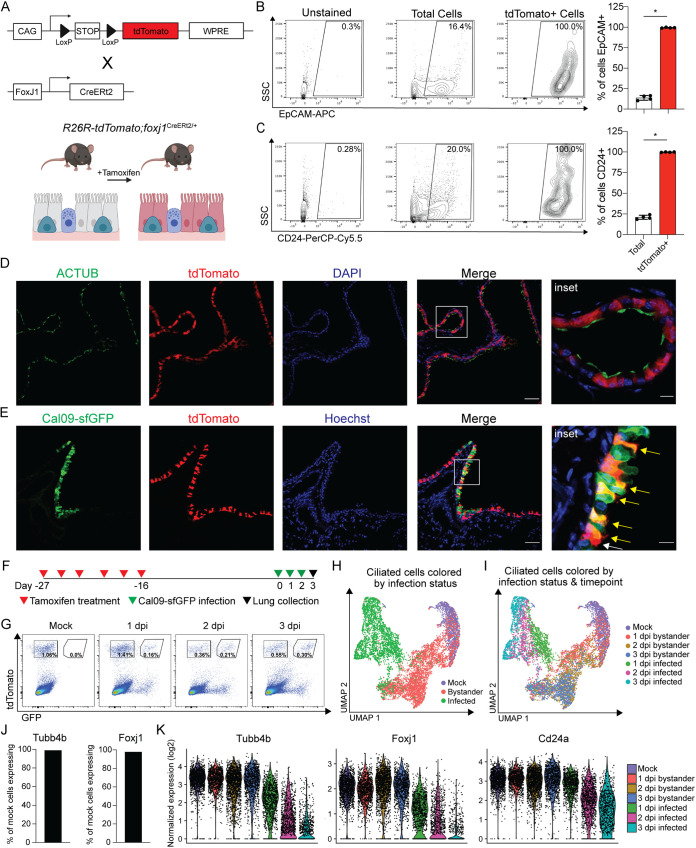
A transgenic mouse model genetically labels ciliated cells for identification during infection. (A) Schematic of transgenic mouse model. Mice containing a Cre-responsive reporter cassette were crossed to mice expressing Cre recombinase under the promoter for the ciliated cell-specific transcription factor Foxj1. When tdT;foxj1 mice are treated with tamoxifen, ciliated cells permanently express tdTomato. WPRE, woodchuck hepatitis virus posttranscriptional regulatory element. (B) Representative flow cytometry and quantification of total and tdTomato+ cell surface EpCAM expression. Cells isolated from the lungs of tamoxifen-treated tdT;foxj1 mice. Means with SDs are shown. n = 4; Mann-Whitney U test. (C) Representative flow cytometry and quantification of total and tdTomato+ cell surface CD24 expression. Cells isolated from the lungs of tamoxifen treated tdT;foxj1 mice. Means with SDs are shown. n = 4; Mann-Whitney U test. (D) Cross-sectioned microscopy of lung epithelial cells from tamoxifen treated tdT;foxj1 mice. ACTUB (green), cilia; tdTomato (red), Foxj1 activity; DAPI (blue), DNA. Scale bar, 50 μm, 10-μm inset. Image representative of two independent experiments with at least 2 mice each. (E) Cross-sectioned microscopy of lung epithelial cells from tamoxifen-treated tdT;foxj1 mice 24 hpi with Cal09-sfGFP. Cal09-sfGFP (green), GFP; tdTomato (red), Foxj1 activity; Hoechst (blue), DNA. Yellow arrows, GFP+ ciliated cells. White arrows, GFP- ciliated cells. Scale bar, 50 μm; 10-μm inset. Image representative of two independent experiments with at least 2 mice each. (F) Schematic of scRNA-seq experiment design. TdT;foxj1 mice were treated with tamoxifen six times over 2 weeks followed by a 2-week recovery period before infection with Cal09-sfGFP. Total lung cells were isolated at the indicated times postinfection for FACS. (G) Flow cytometry of FACS-sorted tdTomato+ ciliated cells isolated from tamoxifen-treated tdT;foxj1 mice at the indicated times postinfection with Cal09-sfGFP or mock infected with PBS. (H) UMAP dimensionality reduction plot showing ciliated cells clustered based on their transcriptomes and relation to one another. Ciliated cells are colored based on their infection status. (I) UMAP dimensionality reduction plot showing ciliated cells clustered based on their transcriptomes and relation to one another. Ciliated cells are colored based on their infection status and time point. (J) The percentage of mock tdTomato+ cells with at least one transcript of ciliated cell markers Tubb4b and Foxj1. (K) Violin plot of normalized expression of ciliated cell markers Tubb4b, Foxj1, and CD24a by sample. The width of each violin represents the frequency of that expression level. For all panels, ns, not significant, and *, P ≤ 0.05.

