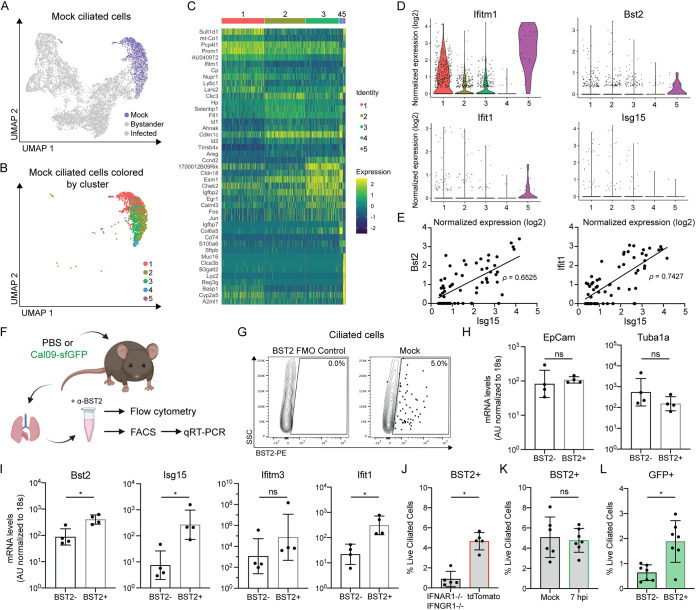
FIG 3.
Identification of a subpopulation of ciliated cells with basal ISG expression prior to infection. (A) UMAP dimensionality reduction plot showing ciliated cells clustered by their transcriptome similarity. Mock ciliated cells are colored purple. (B) UMAP dimensionality reduction plot showing clusters of mock ciliated cells containing at least one transcript of Foxj1. (C) Heat map of the top 10 most variably expressed genes by each mock ciliated cell cluster. Genes are ordered based on P value. The scale of the heat map shows the expression of a gene by each cell relative to the mean expression by all cells in the sample. (D) Violin plots showing the normalized expression of each ISG by the cells in each cluster. The width of each violin represents the frequency of that expression level. (E) Normalized expression of the ISGs Bst2 and Ifit1 plotted against normalized expression of Isg15 in mock cells containing at least one transcript of Isg15. Pearson’s correlation coefficient, ρ, was used to measure the linear correlation of expression. (F) Schematic of experiments used to evaluate basal ISG expression in ciliated cells in panels G to L. (G) Representative flow cytometry of ciliated cells (CD45− CD31− CD24+) isolated from mock-infected mice stained for BST2/tetherin. The BST2 gate was set using fluorescence minus one (FMO) control as shown on the left side of the panel. (H and I) qRT-PCR of mRNA isolated from FACS-sorted BST2+ or BST2− ciliated cells (CD45− CD31− CD24+) was used to quantify transcripts for ciliated cell marker genes (EpCam, Tuba1a) (H) and ISGs (Bst2, Isg15, Ifitm3, and Ifit1) (I). Gene expression was quantified based on a standard curve and normalized to endogenous 18s expression. Means with SDs are shown. n = four independent mice; Mann-Whitney U test. AU, arbitrary units. (J) Quantification of flow cytometry. Ciliated cells (CD45− CD31− CD24+) were isolated from untreated IFNAR1−/− IFNGR1−/− or tdTomato mice and stained for BST2. Means with SDs are shown; n = 5 mice per group; Mann-Whitney U rest. (K) Quantification of flow cytometry. Ciliated cells (CD45− CD31− CD24+) were isolated from mock-infected or Cal09-sfGFP-infected (1.4e5 PFU) mice 7 hpi and stained for BST2. Means with SDs are shown; n = at least 6 mice per group from two independent experiments; Mann-Whitney U test. (L) Quantification of flow cytometry. GFP expression by BST2+ or BST2− ciliated cells (CD45− CD31− CD24+) isolated from mice 7 hpi with Cal09-sfGFP (1.4e5 PFU) was measured. Means with SDs are shown. n = 7 mice from two independent experiments; Mann-Whitney U test. For all panels, ns, not significant, and *, P ≤ 0.05.

