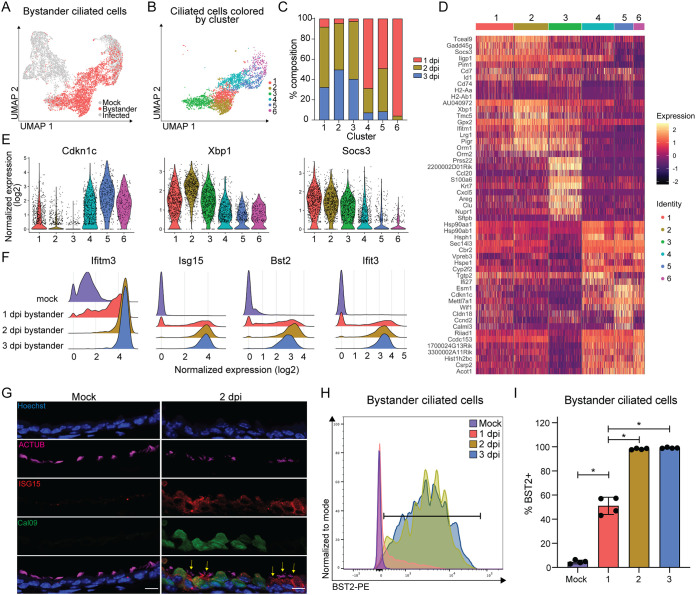
FIG 4.
Uninfected bystander ciliated cells respond homogenously to pulmonary inflammation during IAV infection. (A) UMAP dimensionality reduction plot showing bystander cells. (B) UMAP dimensionality reduction plot showing unbiased clustering of bystander GFP− ciliated cells. GFP− ciliated cells were considered bystander cells if they had less than 10 viral transcripts. (C) Stacked bar graph plotting the percentage of each cluster that belongs to each time point. (D) Heat map of the top 10 most variably expressed genes by each cluster of bystander GFP− ciliated cells. Genes are ordered based on P value. The scale of the heat map shows the expression of a gene by each cell relative to the mean expression by all cells in the sample. (E) Violin plot showing the normalized expression of Cdkn1c (negative regulation of cell cycle), Xbp1 (stress response), and Socs3 (interferon signaling). The width of each violin represents the frequency of that expression level. (F) Ridge plots depicting normalized expression of ISGs, grouped by sample. Ridge height indicates the frequency of expression level. (G) Microscopy of cross-sectioned lung epithelial cells from mock- or Cal09-sfGFP-infected mice (2 dpi) stained for ACTUB and ISG15. Scale bar, 10 μm. Yellow arrows indicate ISG15+ bystander ciliated cells. Image representative of sections from three mice from two independent experiments. (H) Flow cytometry of bystander ciliated cells (CD45− CD31− CD24+ GFP−) stained for BST2. Ciliated cells were isolated from the lungs of mock-infected or Cal09-sfGFP-infected mice at the indicated times postinfection. Gate for BST2 was set using FMO control. (I) Quantification of flow cytometry in panel H. Means with SDs are shown; n = 4 mice per group; Mann-Whitney U test. For all panels, ns, not significant, and *, P ≤ 0.05.

