FIG 5.
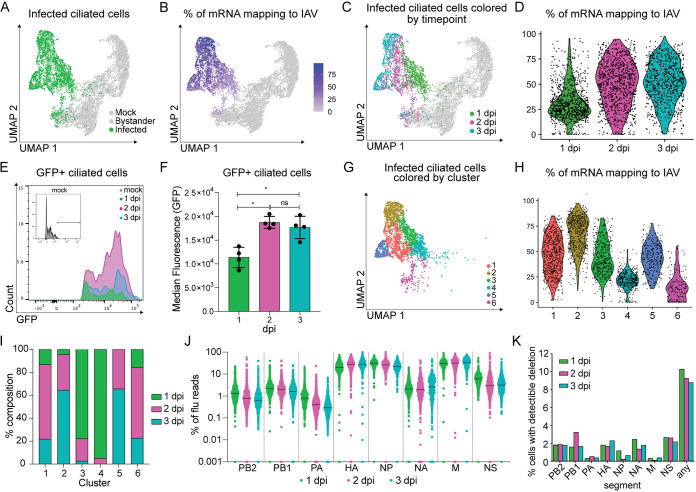
Viral replication characteristics across ciliated cells during the first 3 days of infection. (A) UMAP dimensionality reduction plot depicting infected ciliated cells. (B) UMAP dimensionality reduction plot of total ciliated cells shaded based on the fraction of total mRNA transcripts that are viral. (C) UMAP dimensionality reduction plot depicting GFP+ ciliated cells 1, 2, or 3 days post-Cal09-sfGFP infection. (D) Violin plot showing the fraction of total mRNA transcripts that are viral for each GFP+ cell grouped by sample. Violin width indicates the frequency of the percentage level. (E) Representative flow cytometry histogram of GFP+ ciliated cells (CD45− CD31− CD24+). Ciliated cells were isolated from mock-infected or Cal09-sfGFP-infected mice at the indicated times postinfection. (F) Quantification of the median fluorescence (GFP) of GFP+ ciliated cells in panel E. Means with SDs are shown; n = 4 mice per time point; Mann-Whitney U test. (G) UMAP dimensionality reduction plot depicting clusters of infected cells (GFP+, ≥10 viral transcripts), which are colored by cluster identity. (H) Violin plot showing the fraction of total mRNA transcripts that are viral for each GFP+ cell grouped by cluster identity. Violin width indicates the frequency of the percentage level. (I) Quantification of the fraction of cells from each time point that make up each cluster. Cells were clustered based on host and viral gene expression. (J) Plot showing the fraction of total viral transcripts belonging to each influenza segment in infected GFP+ cells, grouped by time point. GFP+ cells were classified as infected based on the presence of 10 or more viral transcripts. If a fraction for a gene was 0, it was set to 0.001 for inclusion in the plot. (K) Bar graph depicting the percentage of infected cells (GFP+, ≥10 viral transcripts) with detectable deletions (>15 reads, >75 nt deletion, final product > 150 nt) in each flu segment or any segment.

