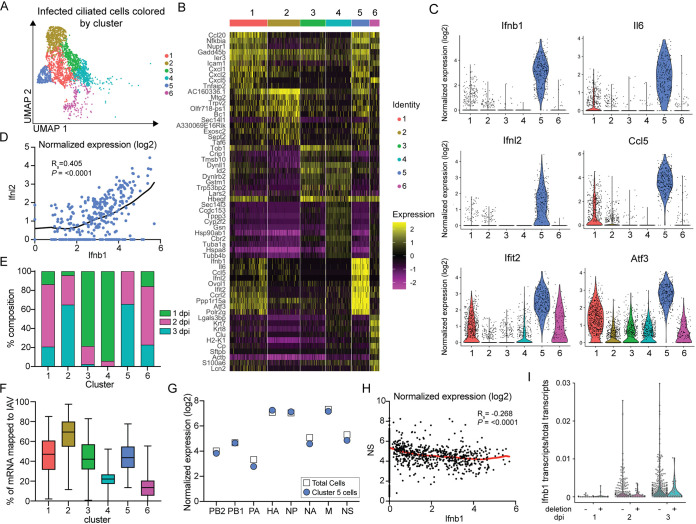
FIG 6.
Inflammatory antiviral responses are restricted to a subpopulation of infected ciliated cells during infection. (A) UMAP dimensionality reduction plot showing unbiased clustering of infected GFP+ cells. GFP+ cells were classified as infected based on the presence of 10 or more viral transcripts. Clustering was based on the expression of host genes only. (B) Heat map of the top 10 most variably expressed genes by each cluster of infected GFP+ ciliated cells. Cells are clustered based on host gene expression only. Genes are ordered based on P value. The scale of the heat map shows the expression of a gene by each cell relative to the mean expression by all cells in the sample. (C) Violin plots of normalized expression for 6 of the top 10 most variably expressed genes in cluster 5. Violin width indicates the frequency of the expression level. (D) Plot of the normalized expression (log2) of Ifnb1 versus Ifnl2 by cells in cluster 5. A locally weighted scatterplot smoothing (LOWESS) curve was fitted to visualize the relationship of expression. Spearman’s rank order correlation, P < 0.0001; we reject the null hypothesis that there is no correlation between Ifnb1 and Ifnl2 expression. (E) Stacked bar graph showing the percentage of each cluster in panel A that belongs to each of the three GFP+ time points. (F) Box-and-whisker plot showing the fraction of total mRNA transcripts that are virally grouped by cluster. Clustering was based on the expression of host genes only. Box extends from 25th to 75th percentiles with a line representing the median value for each cluster. Whiskers extend to the minimum and maximum value. (G) Plot of average normalized expression of each viral gene for total infected GFP+ cells and cluster 5 cells. (H) Plot of the normalized expression of Ifnb1 versus NS for total infected GFP+ cells. A LOWESS curve was fitted to visualize the relationship of expression. Spearman’s rank order correlation, P < 0.0001; we reject the null hypothesis that there is no correlation between Ifnb1 and NS expression. (I) Distribution of Ifnb1 transcripts normalized to total cellular transcripts in GFP+ infections in which deletions were (+) and were not (−) detected according to our thresholds. For all panels: ns, not significant, and *, P ≤ 0.05.

