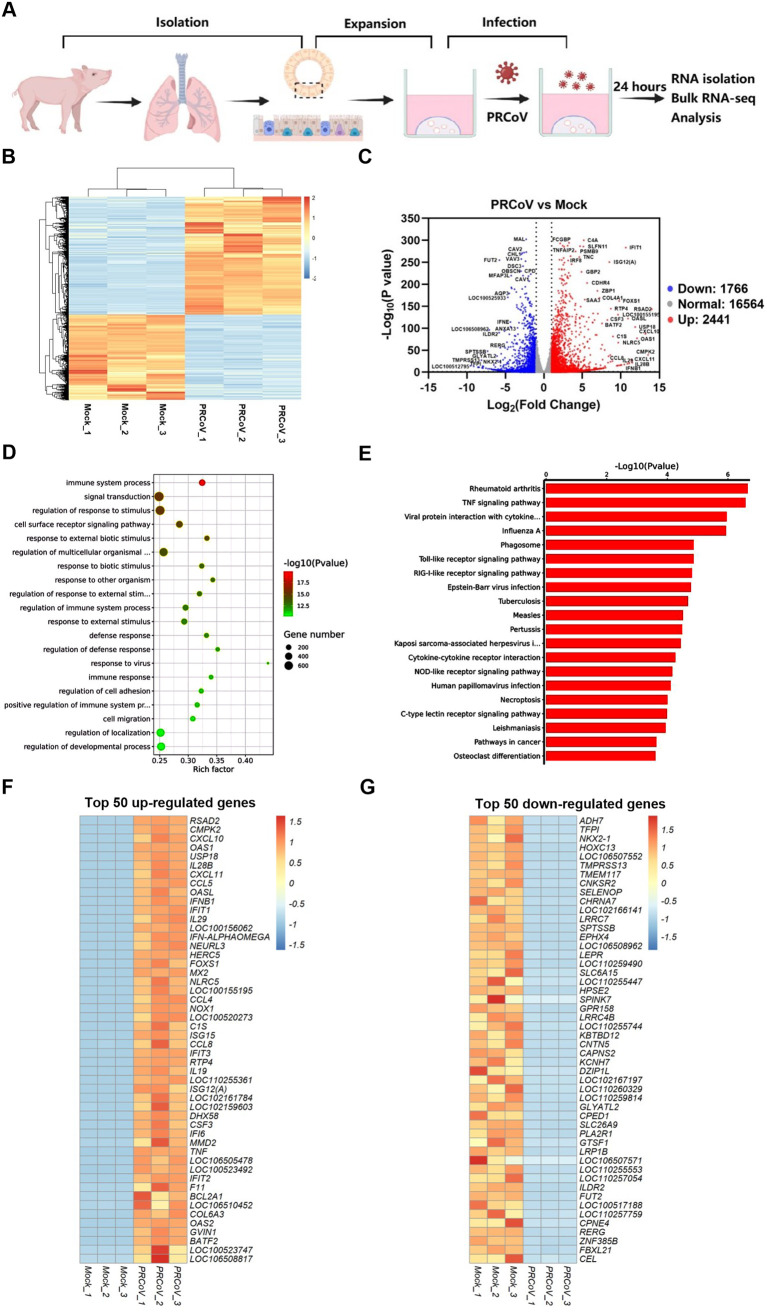
FIG 6.
Transcriptional profiles in AOs following PRCoV infection. (A) Schematic for bulk RNA-seq of PRCoV-infected AO samples. (B) Heatmap of common differentially expressed genes in 3D AOs after PRCoV infection. (C) Volcano plot showing differentially expressed genes in PRCoV-infected AOs. (D and E) GO (D) and KEGG pathway (E) enrichment analyses of differentially expressed genes in PRCoV-infected AOs. (F and G) Heatmap showing the top 50 up- (F) or downregulated (G) genes modified by PRCoV in AOs. 3D AOs derived from the trachea of 2-day-old piglets were infected with or without PRCoV for 24 hpi. Total RNA was isolated from AOs, and the changes in gene expression were determined by bulk RNA-seq. Data are based on log(RPKM) values from three independent biological preparations.

