FIG 4.

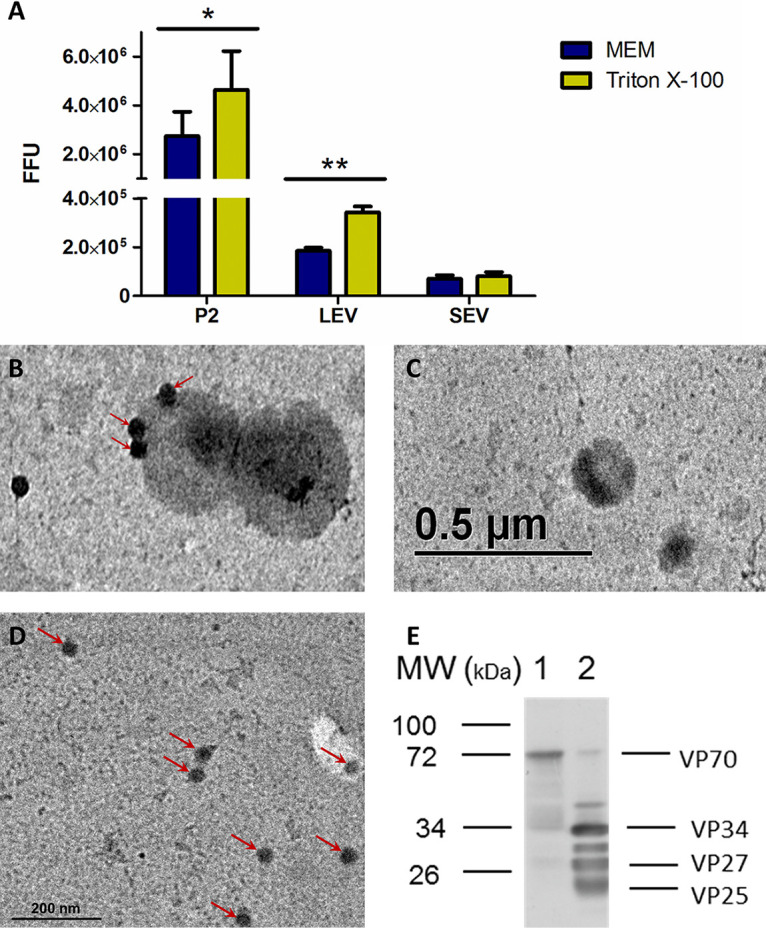
Astrovirus particles associate with large extracellular vesicles. Caco-2 cells were infected with astrovirus Yuc8 (MOI of 5) or mock infected, and supernatants were harvested 18 h postinfection and processed by differential centrifugation, fraction P2 at 2,000 g, fraction containing large extracellular vesicles (LEV) at 20,000 g and final small extracellular vesicles (SEV) fraction was obtained by precipitation with PEG 6000, and NaCl after centrifugation at 10,000 g. All fractions were resuspended in same volume (100 μL) of sterile PBS. (A) Viral titer was determined after activation with trypsin, with or without previous incubation with detergent. Viral content was expressed as total focus forming units. Yellow bars represent samples treated with 0.1% Triton X-100 prior trypsin activation; blue bars (MEM), represent samples activated with trypsin without Triton X-100 treatment. The mean of viral particles in each sample ± standard error of the mean of three independent experiments are shown. (B) Large extracellular vesicles purified from Yuc8 infected, or (C) non infected Caco-2 cells were further clarified by additional isolation using MagCapture Exosome isolation kit PS. One drop of sample was fixed onto carbon vaporized coper grids and negative stained with uranyl acetate. Samples were observed in EFTEM ZEISS Libra 120 electron microscope. Electro-dense particles of 30 nm, possibly viral particles, are pointed by arrows. (D) Purified Yuc8 virions were bound to carbon vaporized coper grids and stained as described in B. Electrodense particles, which resemble astrovirus particles are pointed by arrows. Size bars are shown. (E) Immunoblotting of LEV fraction. Sample used in A, purified from Caco-2 infected cells, was not-treated (lane 1) or treated (lane 2) with trypsin, and separated in SDS-PAGE, transferred to nitrocellulose membrane and viral proteins were detected using anti-astrovirus polyclonal antibody. Viral proteins are pointed on right hand side, while molecular weight in kilodaltons is shown on left hand side. Images are representative of three independent experiments yielding similar results. Statistical analysis was done with two-way ANOVA, P value *< 0.05; **, P < 0.01; ***, P < 0.001.
