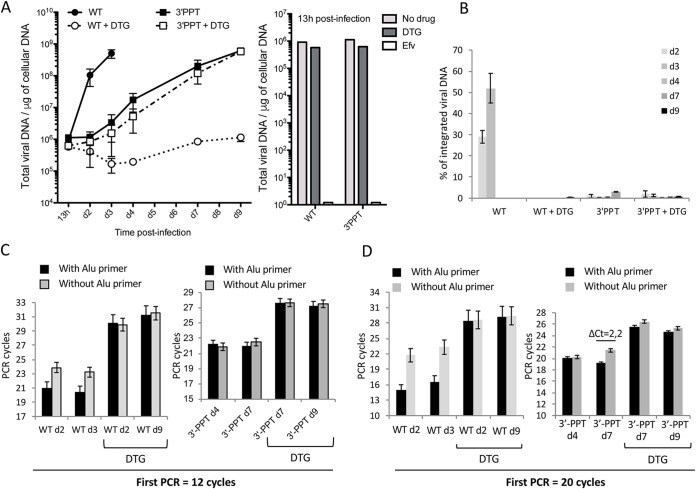
FIG 1.
Replication of the WT and 3′-PPT mutant viruses in MT4 cells. MT4 T-cells were infected with WT or 3′-PPT mutant (100 ng of p24 per one million cells) in the absence or presence of 1 μM DTG. Quantitative-PCR (qPCR) was performed to quantify total viral DNA (A) and integrated viral DNA (B–D) during the course of the experiment. (A) Left panel: total viral DNA is expressed in copies per μg of DNA during the course of infection. The graph shows one representative experiment or three independent experiments. Right panel: total viral DNA at 13h postinfection. (B) Percentage of integrated viral DNA over total viral DNA. Results are shown for three independent experiments (mean ± standard deviation (SD)). (C) The ΔCt obtained for each condition of amplification with 12 cycles (with the Alu primer (black column) and without the Alu primer (gray column)) is shown for the WT and 3′-PPT mutant samples, with or without DTG. (D) The number of PCR cycles for the first ALU-LTR reaction was increased (20 cycles instead of 12 (B)). The ΔCt obtained for each condition of amplification of the same samples described in (B) (with Alu primer (black column) and without Alu primer (gray column)) is shown. Results are shown for three independent experiments (mean ± SD). Statistical differences were calculated using Student's t test (*, P < 0.05; **, P < 0.005; ***, P < 0.001; ns P > 0.05).

