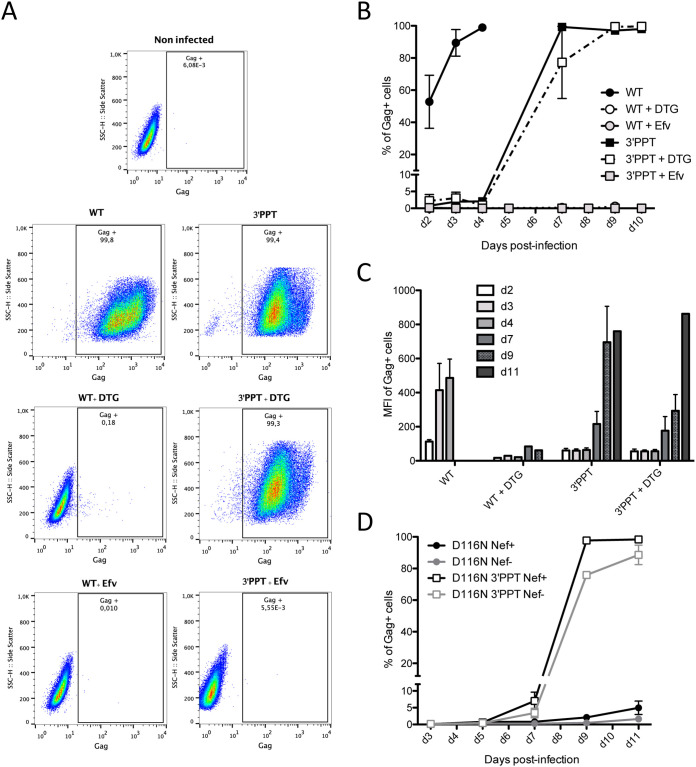
FIG 3.
Expression from viral DNA of the 3′-PPT mutant virus is higher than that from nonintegrated viral DNA of the WT virus but lower than that of integrated viral DNA. MT4 T cells were infected with the WT and 3′-PPT mutant virus, with or without 1 μM DTG. (A) Gating strategy for flow cytometry analysis of intracellular gag synthesis after infection with the WT (left panel) or 3′-PPT mutant virus (right panel), with or without 1 μM DTG. Efavirenz (Efv) was used as a control to ensure that gag detection was not due to the initial infection. Data are representative of three independent experiments. Immunofluorescent staining was performed using an anti-Gag antibody (recognizing p55, p39, p33 and p24 proteins) conjugated to phycoerythrin (PE). Analysis was performed at d7 postinfection except for the WT virus (d2 postinfection). (B) The amount of intracellular gag antigen was quantified at various time points by immunofluorescent staining using an anti-Gag antibody conjugated to phycoerythrin (PE). Results are expressed as the percentage of Gag positive cells during the course of infection. Efavirenz (Efv) was used as a control to ensure that gag detection was due to de novo synthesis and not the persistence of gag antigen from the initial infection. Graph shows the mean ± (SEM) of 3 independent experiments. (C) The mean fluorescence intensity of phycoerythrin (PE) in Gag-PE+ cells during the course of infection is shown. Graph shows the mean ± (SEM) of 3 independent experiments. (D) MT4 T cells were infected with an integrase mutant virus (D116N), with an intact 3′-PPT region or with the mutated 3′-PPT (3′-PPT). Moreover, since mutations of the 3′-PPT destroyed the Nef gene, the Nef gene was rescued (Nef+) or not (Nef-). At different times postinfection, the percentage of cells expressing the Gag antigen was analyzed by immunofluorescent staining using an anti-Gag antibody conjugated to phycoerythrin (PE). Graph shows the mean ± (SEM) of 3 independent experiments.

