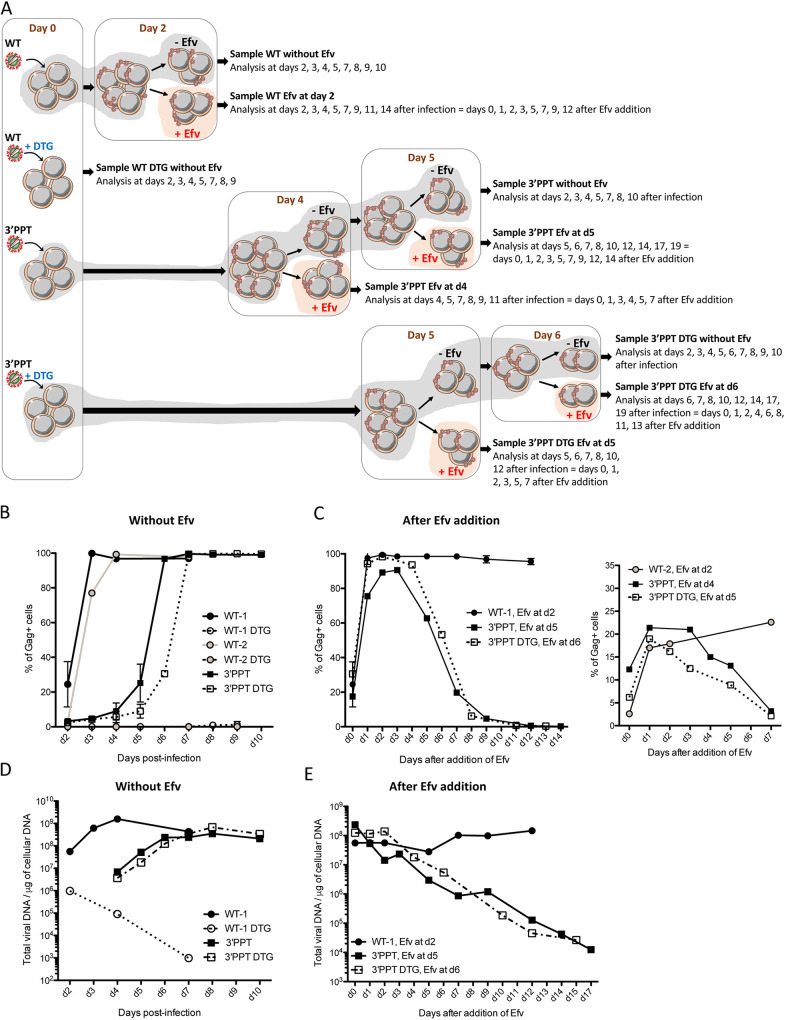
FIG 4.
Instability of the 3′-PPT mutant genome relative to that of the WT virus. (A) Experiment workflow. MT4 T cells were infected with the WT or 3′-PPT mutant virus, with or without 200 nM DTG. Two different quantities of virus were used for the WT virus (50 ng per million cells and 10 ng per million cells, WT-1 and WT-2, respectively). 100 ng of p24 per million cells were used for the 3′-PPT mutant infection. At 2 days postinfection, cells infected with WT-1 or WT-2 were split in two conditions: 100 nM Efavirenz (Efv) was added on part of cells in order to prevent further rounds of replication (samples WT-1, Efv at d2 and WT-2, Efv at d2) while the other part of cells remained without Efv (samples WT-1 and WT-2). For cells infected with the 3′-PPT virus, cells were split and 100 nM Efv was added at day 4 (sample 3′-PPT, Efv at d4). Cells without Efv have been again split at d5 for Efv addition (sample 3′-PPT, Efv at d5). For cells infected with the 3′-PPT virus + DTG, cells were split and 100 nM Efv was added at day 5 (sample 3′-PPT DTG, Efv at d5). Cells without Efv have been again split at d6 for Efv addition (sample 3′-PPT DTG, Efv at d6). Efv was added at different times postinfection, depending on the condition of infection, to add Efv when the percentage of gag+ cells was similar for all conditions. All samples were analyzed at different times points postinfection by intracellular gag antigen staining in order to measure the percentage of gag+ cells (B–C) or by qPCR analysis in order to quantify the total viral DNA (D–E). (B) Immunofluorescent staining was performed using an anti-Gag antibody and the percentage of gag+ cells is shown for the samples remained without Efv. The graph shows the mean ± SD of two independents experiments. (C) Left panel: Immunofluorescent staining was performed using an anti-Gag antibody and the percentage of gag+ cells is shown for the samples WT-1,Efv at d2, 3′-PPT, Efv at d5 and 3′-PPT DTG, Efv at d6. For these 3 samples, the percentage of Gag+ was between 20 and 30% when Efv was added. Right panel: Immunofluorescent staining was performed using an anti-Gag antibody and the percentage of gag+ cells is shown for the samples WT-2,Efv at d2, 3′-PPT, Efv at d4 and 3′-PPT DTG, Efv at d5. For these 3 samples, the percentage of Gag+ was between 3 and 12% when Efv was added. (D–E) Total viral DNA was quantified during the course of the experiment for samples remained without Efv (D) or for those in which Efv was added (E).

