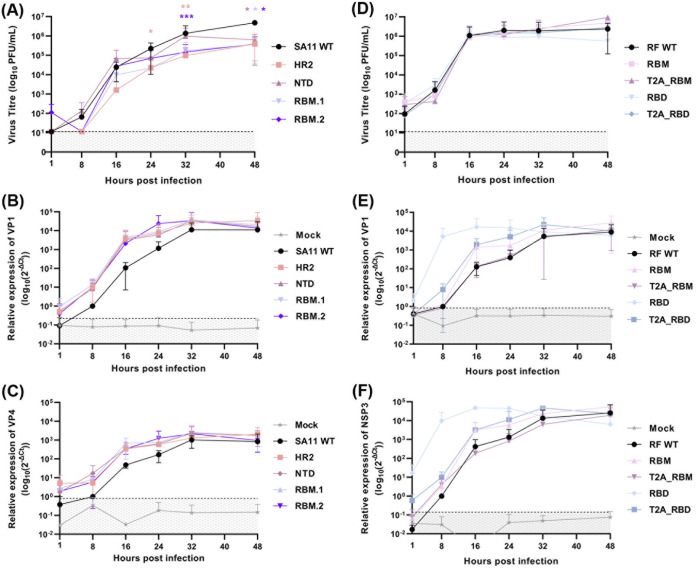
FIG 3.
Replication kinetics and viral RNA content of WT and mutant viruses. (A and B) Multistep growth curves for VP4 and NSP3 mutant viruses respectively. *, P ≤ 0.05 (24 hpi HR2, P = 0.041; 48 hpi NTD, P = 0.047; RBM.1, P = 0.045; RBM.2, P = 0.031). **, P ≤ 0.01 (32 hpi HR2, P = 0.009). ***, P ≤ 0.001 (32 hpi RBM.2, P = 0.0006). (C to F) Total cellular RNA levels of VP1, and VP4 (SA11 panel) or NSP3 (RF panel) transcripts. Data are from three independent experiments. Dashed line represents detection threshold.

