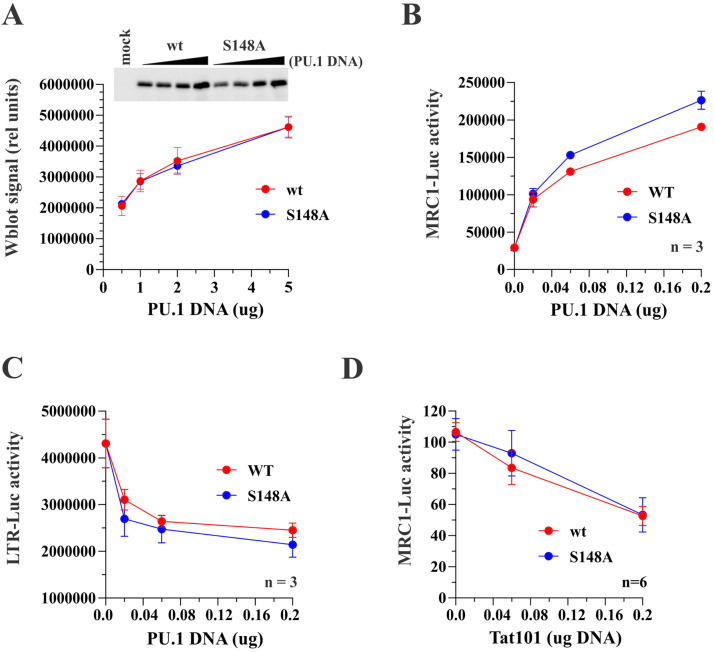
FIG 10.
Phosphorylation at S148 is not critical for PU.1 function or sensitivity to Tat. (A) S148 in PU.1 was mutated to alanine in the backbone of pcDNA-PU.1-HA. Expression of the resulting mutant relative to the wild-type protein was analyzed by immunoblotting. For that, HEK293T cells were transfected with increasing amounts (0.5, 1.0, 2.0, and 5.0 μg) of pcDNA-PU.1-HA WT or pcDNA-PU.1-HA S148A. Cells were harvested 24 h later and processed for immunoblotting using HA tag-specific antibodies. Band intensities were quantified using Bio-Rad Image Lab software and blotted as a function of transfected PU.1 DNA. Quantitation of PU.1 WT is shown in red; quantitation of the S148A mutant is shown in blue. Means and error bars representing SEM calculated from three independent experiments are shown. (B and C) The ability of PU.1 S148A to activate the MRC1 promoter (B) and to inhibit the HIV-1 LTR promoter (C) was tested in HEK293T cells. Cells were transfected with pGL-HMRC1-Luc (0.1 μg) or pGL-LTR-Luc (0.1 μg) together with increasing amounts (0, 0.02, 0.06, and 0.2 μg) of pcDNA-PU.1-HA (red lines) or pcDNA-PU.1-HA S148A (blue lines). (D) The ability of Tat to interfere with the inhibition of the MRC1 promoter by PU.1 S148A was tested by transfecting HEK293T cells with pGL-MRC1-Luc (0.1 μg) and either pcDNA-PU.1-HA WT (0.1 μg; red line) or pcDNA-PU.1-HA S148A (0.1 μg; blue line), along with increasing amounts (0, 0.02, 0.06, and 0.2 μg) of pTat101. (B to D) Luciferase activity was measured 24 h later. Means and error bars representing the SEM calculated from 3 to 6 experiments as indicated in the figure panels are shown. Statistical analyses demonstrate that while the slope (i.e., the change in outcome between the lowest and largest amounts of PU.1 [panels B and C] or Tat DNA [panel D]) for each group is significant, there are no significant differences between the curves for PU.1 wild type and PU.1 S148A in all three assays. Thus, at 0.2 μg, there are no statistically significant differences between PU.1 wild type and PU.1 S148A in all three assays. For details on the statistical analyses, see Fig. S1 in the supplemental material.

