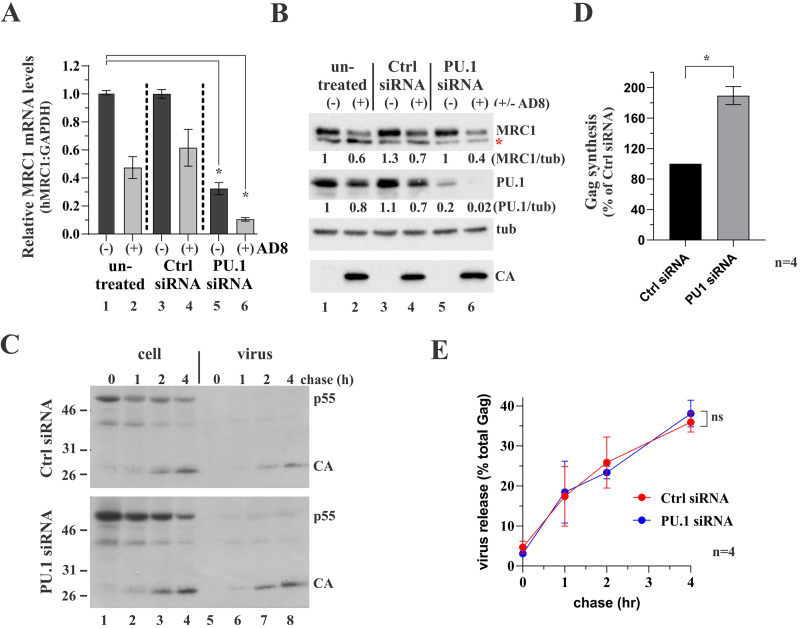
FIG 7.
Silencing of PU.1 upregulates gene expression in HIV-1-infected MDMs. (A and B) Monocytes from a healthy donor were plated in 6-well plates (4 × 10⁶/well; 18 wells total) and allowed to differentiate into MDMs for 6 days. Nine wells were then infected with VSVg-pseudotyped HIV-1 AD8 WT virus stock; the other nine wells remained uninfected. On days 9 and 11, cells were treated as follows: 3 wells each of infected and uninfected cells were left untreated (lanes 1 and 2) or were treated with nontargeting siRNA (lanes 3 and 4) or PU.1 siRNA (lanes 5 and 6). (A) One day later, cells from two of the three wells were processed for RT-qPCR as detailed in Materials and Methods. RT-qPCR was done twice in triplicate sets. MRC1 mRNA levels were plotted relative to GAPDH mRNA levels. Mean and error bars representing SEM from replicate data sets are shown. Differences in relative MRC1 mRNA levels between column 1 and columns 2, 3, and 4 were not statistically significant. Differences in relative MRC1 mRNA levels between column 1 and columns 5 and 6 are statistically significant (P = 0.022 and P = 0.001, respectively). For details on the statistical analyses, see Fig. S1 in the supplemental material. (B) Cells from the third well of each set were processed for immunoblotting and probed for expression of MRC1, PU.1, tubulin (tub), and HIV-1 Gag (CA). The red star in the MRC1 blot indicates a nonspecific background band as noted in Fig. 1. (C) MDMs (4 wells of a 6-well plate) were infected with VSVg-pseudotyped HIV-1 AD8 WT virus stock as in panels A and B. On days 9 and 11 postinfection, cultures were treated with nontargeting control siRNA (Ctrl siRNA) or with PU.1-specific siRNA (PU.1 siRNA). Cells were collected on day 12 and labeled for 25 min with [35S]-Expre35S35S-label and chased for up to 4 h as indicated on the top. Detergent extracts were immunoprecipitated with HIV-1 IgG, separated by SDS-PAGE, and visualized by fluorography. Proteins are identified on the right. Representative gels from one of four independent pulse-chases are shown. (D) Signals for p55gag at the end of the pulse (lane 1 in panel C) were quantified by phosphoimage analysis. The signal obtained with the control samples (nontargeting siRNA treated) was defined as 100% in each of the four replicate experiments. The signal obtained with the PU.1 siRNA-treated samples was calculated relative to the control. Mean and error bars representing SEM from four independent experiments are shown. Differences are statistically significant (P = 0.005). For details on the statistical analyses, see Fig. S1. (E) Silencing of PU.1 does not affect virus assembly and release. Gag-specific bands from panel C were quantified by phosphoimage analysis, and the fraction of extracellular Gag present at each time point was calculated as percentage of the total intra- and extracellular Gag. Means and error bars representing SEM calculated from four independent experiments are shown. Differences between the two samples at 4 h are not statistically significant (P = 0.623). For details on the statistical analyses, see Fig. S1.

