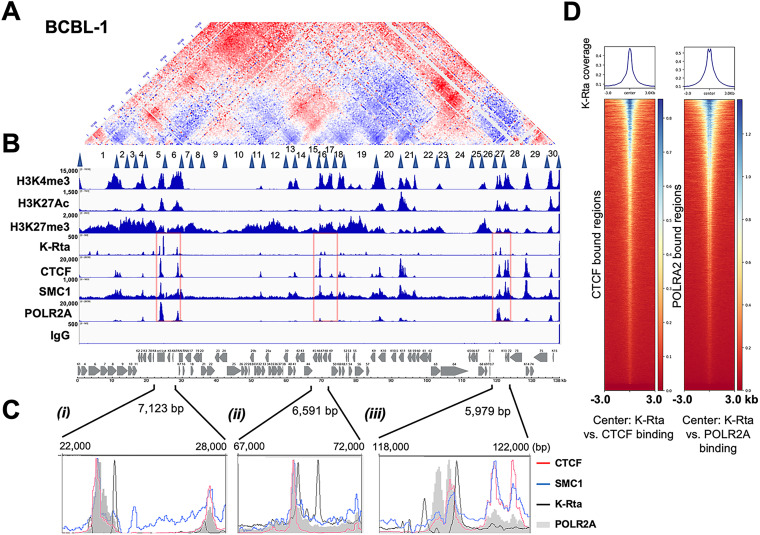
FIG 2.
Superimposition of select histone modifications and protein factor binding sites on genomic contacts of the latent KSHV genome. (A) The BCBL-1 contact map. The BCBL-1 contact map from Fig. 1C is shown. Latent TRDs numbered 1–30 with their borders (blue triangles) (from Fig. 3A) are listed below the contact map. (B) Histone modification and protein recruitment sites. Alignment of histone modifications H3K4Me3, H3K27Ac, H3K27me3, and binding sites of K-Rta (TREx-BCBL-1; reactivated, 12 h), CTCF, SMC1, and POLR2A in BCBL-1 from CUT&RUN or ChIP-seq (K-Rta) are shown. Control IgG for background control with CUT&RUN is also shown. The sequence reads were mapped to the KSHV genome. IGV snapshots and a KSHV genome map are shown. Numbers on the left-hand side of each track denotes the height of the peak (e.g., read depth). (C) Zoomed view of CTCF, SMC1, K-Rta, and RNAPII enrichment at select regions of the KSHV genome (i) K4-PAN RNA, (ii) ORFs 45–50, and (iii) K12 region. (D) Genome-wide correlation among K-Rta, CTCF, and RNAPII recruitment sites. Density plots showing average K-Rta ChIP-seq signals within ±3 kb regions around the center of CTCF or POLR2A peaks. The heatmap shows K-Rta signals on CTCF or POLRA2 CUT&RUN peaks. The y axis is ranked according to CTCF or POLR2A enrichment in descending order.

