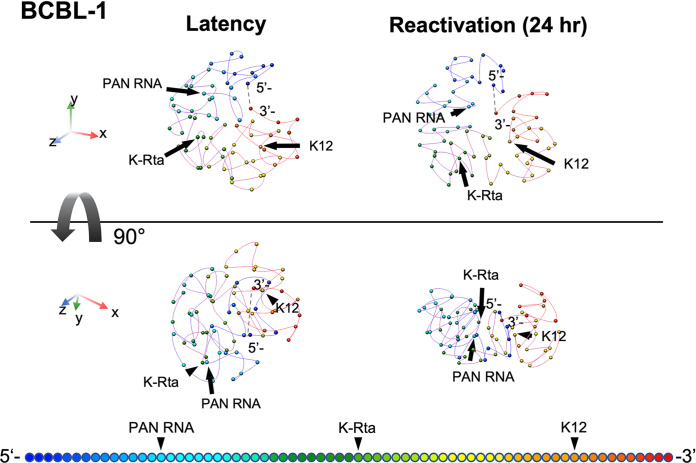
FIG 4.
KSHV 3D genomic structure modeling. Frequencies of ligated fragments were used to calculate distances between fragments at 2 kb resolution. The average of 8 different models were used to draw the figures. KSHV 3D genomic structure before (left) and after (right) triggering reactivation are shown. The 90-degree rotated views are also shown in the panels (bottom). Color gradation associated with KSHV genomic position are depicted at the bottom of figures. The movies of the 3D figures including individual 8 models in shadow are presented in Fig. S5. The dotted line in each structure represents the putative terminal repeat (TR) position. Each sphere marks 2 kb of linear genomic sequence.

