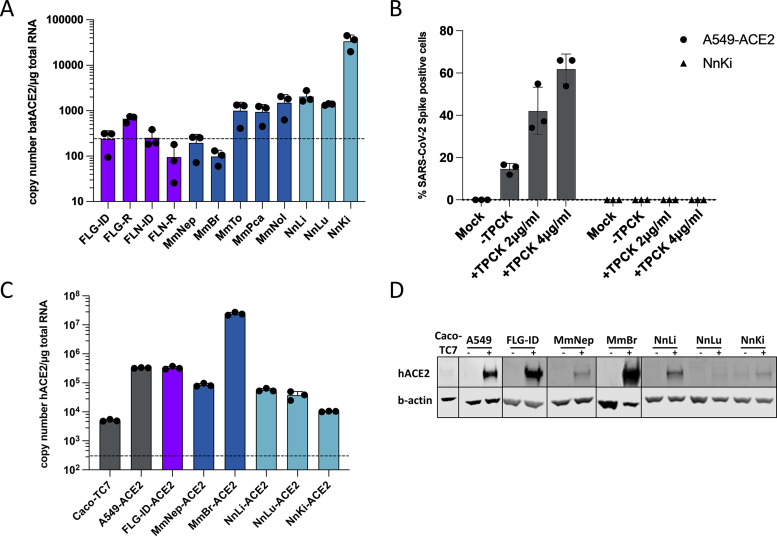
FIG 2.
Expression of endogenous ACE2 or ectopically expressed hACE2 in bat cell lines. (A) Quantification of copy numbers per μg of total cellular RNA of endogenously expressed ACE2 in indicated bat cell lines via qPCR analysis. (B) A549-ACE2 and NnKi cells were left uninfected (Mock) or were infected with SARS-CoV-2 at an MOI of 1 in the absence of FBS and TPCK (–TPCK) or in the absence of FBS and the presence of trypsin TPCK at 2 or 4 μg/mL. The percentages of S-positive cells were determined by flow cytometric analysis. Data points represent three biological replicates. (C and D) Indicated bat and human cell lines were stably transduced with a lentivirus vector expressing the hACE2 gene and selected with blasticidin treatment. Human Caco-TC7 intestine cell line served as nontransduced control. (B) The amount of ectopically expressed hACE2 gene in each cell line was measured by qPCR analysis and is indicated as the gene copy number per μg of total cellular RNA. (C) Whole-cell lysates were analyzed by Western blotting with antibodies against the indicated proteins. Western blots are representative of two independent experiments. In panels A and C, a dashed line indicates the limit of detection in the qPCR assays.

