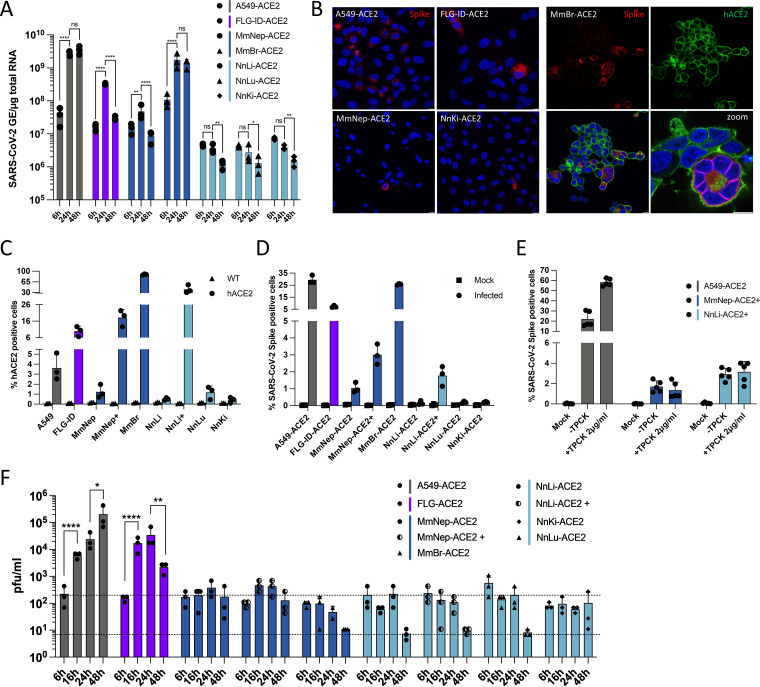
FIG 4.
Expression of hACE2 allows efficient replication of SARS-CoV-2 in Myotis myotis and Eptesicus serotinus cells. Transduced bat cell lines were left uninfected (Mock) or were infected with SARS-CoV-2 at an MOI of 1, with the exception of MmBr cells that were infected at an MOI of 0.04 (A, B, and E). (A) The relative amounts of cell-associated viral RNA were determined by qPCR analysis and are expressed as genome equivalents (GE) per μg of total cellular RNA at different times postinfection. All results are expressed as fold increases relative to uninfected cells. (B) Infected cells were stained at 24 hpi with anti-SARS-CoV-2 S protein (red) and/or anti-hACE2 antibodies (green). Nuclei were stained with Nucblue (blue). Scale bar, 10 μm. (C and D) The percentages of the indicated cells that expressed hACE2 (C) or SARS-CoV-2 S proteins (D) were determined by flow cytometric analysis at 24 hpi. (E) A549-ACE2, MmNep-ACE2+, and NnLi-ACE2+ cells were left uninfected (Mock) or were infected with SARS-CoV-2 at an MOI of 1 in the absence of FBS and TPCK (–TPCK) or in the absence of FBS and presence of trypsin TPCK at 2 μg/mL. The percentages of S-positive cells were determined by flow cytometric analysis. Data points represent two independent experiments (containing two or three technical replicates). (F) The presence of extracellular infectious viruses in the culture medium of the indicated cells was determined by TCID50 assays with Vero E6 cells at 6, 16, 24, and 48 hpi. The lower dashed line indicates the limit of detection, and the upper dashed line indicates the viral input (based on the average titration values at 6 h). (A, D, E, and F) Data points represent three independent experiments. Statistical tests: (a) Dunnett’s multiple-comparison test on a two-way ANOVA (n.s: not significant; *, P < 0.05; **, P < 0.01; ***, P < 0.001; ****, P < 0.0001); (e and f) Tukey’s multiple-comparison test on a two-way ANOVA (ns, not significant; *, P < 0.05; **, P < 0.01; ***, P < 0.001; ****, P < 0.0001).

