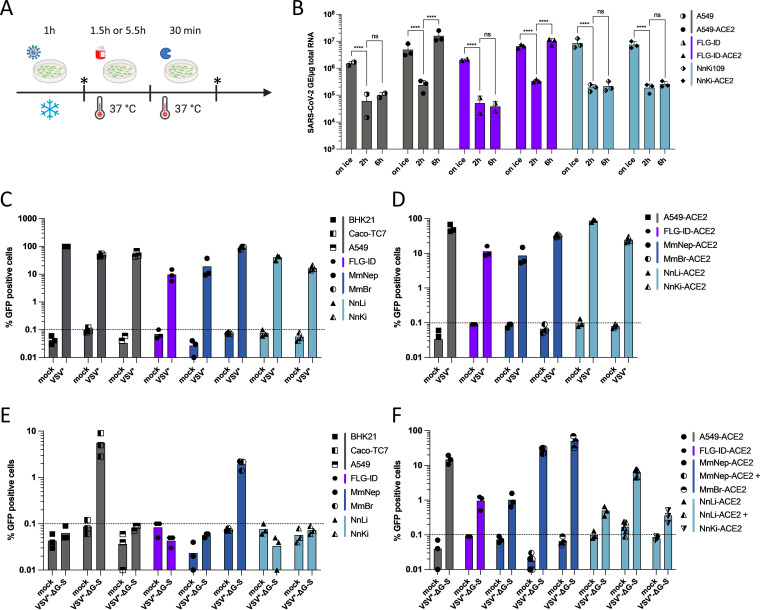
FIG 5.
An abortive entry route exists in bat and human cells. (A) Scheme summarizing the experimental workflow. Cells were incubated with SARS-CoV-2 at an MOI of 1 for 1 h on ice to allow viral attachment. After extensive washing, a portion of the cells was lysed (“on ice”), and the remaining cells were incubated for 1.5 or 5.5 h at 37°C to permit viral internalization. After the incubation period, these cells were lysed after 30 min of trypsinization to remove bound viruses from the cell surface (“2 h” and “6 h”). (B) The relative amounts of cell-associated viral RNA were determined by qPCR analysis and are expressed as genome equivalents (GE) per μg of total cellular RNA as depicted in panel A. All results are expressed as fold increases relative to uninfected cells. Data points represent three independent experiments. Statistical test: Dunnett’s multiple-comparison test on a two-way ANOVA (ns, not significant; *, P < 0.05; **, P < 0.01; ***, P < 0.001; ****, P < 0.0001). (C to F) The indicated cell lines were infected with VSV* (at MOIs ranging from 0.001 to 5) or with VSV*ΔG-S at an MOI of 7. The percentages of infected cells were determined at around 16 to 18 hpi based on GFP expression and flow cytometry analysis. Data points represent independent experiments. Dotted lines represent the limit of sensibility of the assay. (C) BHK21, Caco-TC7, A549, and MmNep cells were infected at an MOI of 0.001, MmBr cells at an MOI of 0.05, FLG-ID cells at an MOI of 5, NnLi cells at an MOI of 0.5, and NnKi cells at an MOI of 0.1. (D) A549-ACE2 and MmBr-ACE2 cells were infected at an MOI of 0.001, MmNep-ACE2 at an MOI of 0.005, FLG-ID-ACE2 cells at an MOI of 5, NnLi cells at an MOI of 0.1, and NnKi cells at an MOI of 0.05.

