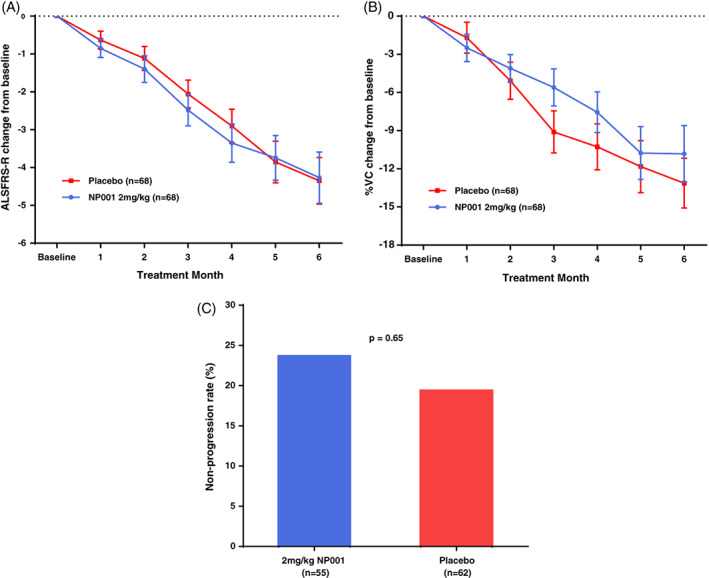
FIGURE 2.

Efficacy of NP001 in the phase 2B mITT population. A, ALSFRS‐R score from baseline over the 6‐mo study in participants treated with NP001 compared with Placebo in the phase 2B mITT population. ALSFRS‐R score change from baseline for participants treated with NP001 depicted in blue (n = 68) and compared with placebo group depicted in red (n = 68). Bars represent mean of ALSFRS‐R score change from baseline ± SEM. No differences were seen between NP001 and placebo groups by the end of study (NP001 = −4.3 vs. Placebo = −4.3) (Wilcoxon test, p = .71). B, Change in % of baseline SVC over 6 mo in participants on NP001 compared with placebo in the phase 2B mITT population. Mean change from baseline in percent predicted SVC for participants treated with NP001(n = 68) is depicted in blue and compared with the placebo group (n = 68) depicted in red. Bars represent mean of % predicted SVC change from baseline ± SEM. There was no significant difference between NP001 treated patients and placebos by the end of study (NP001 = −10.8% vs. Placebo = −13.1%) (Wilcoxon test, p = .15). C, Bar chart of NP001 Non‐progression rate versus placebo group in those who had completed the phase 2B study. Non‐progression rate with non‐progressors defined as no decrease in ALSFRS‐R score at baseline to 6 mo. The proportion of non‐progressors (non‐progression rate) in 2 mg/kg NP001 treatment (13 out of 55) was similar to placebo group (12 out of 62) (Fisher exact test, p = .65)
