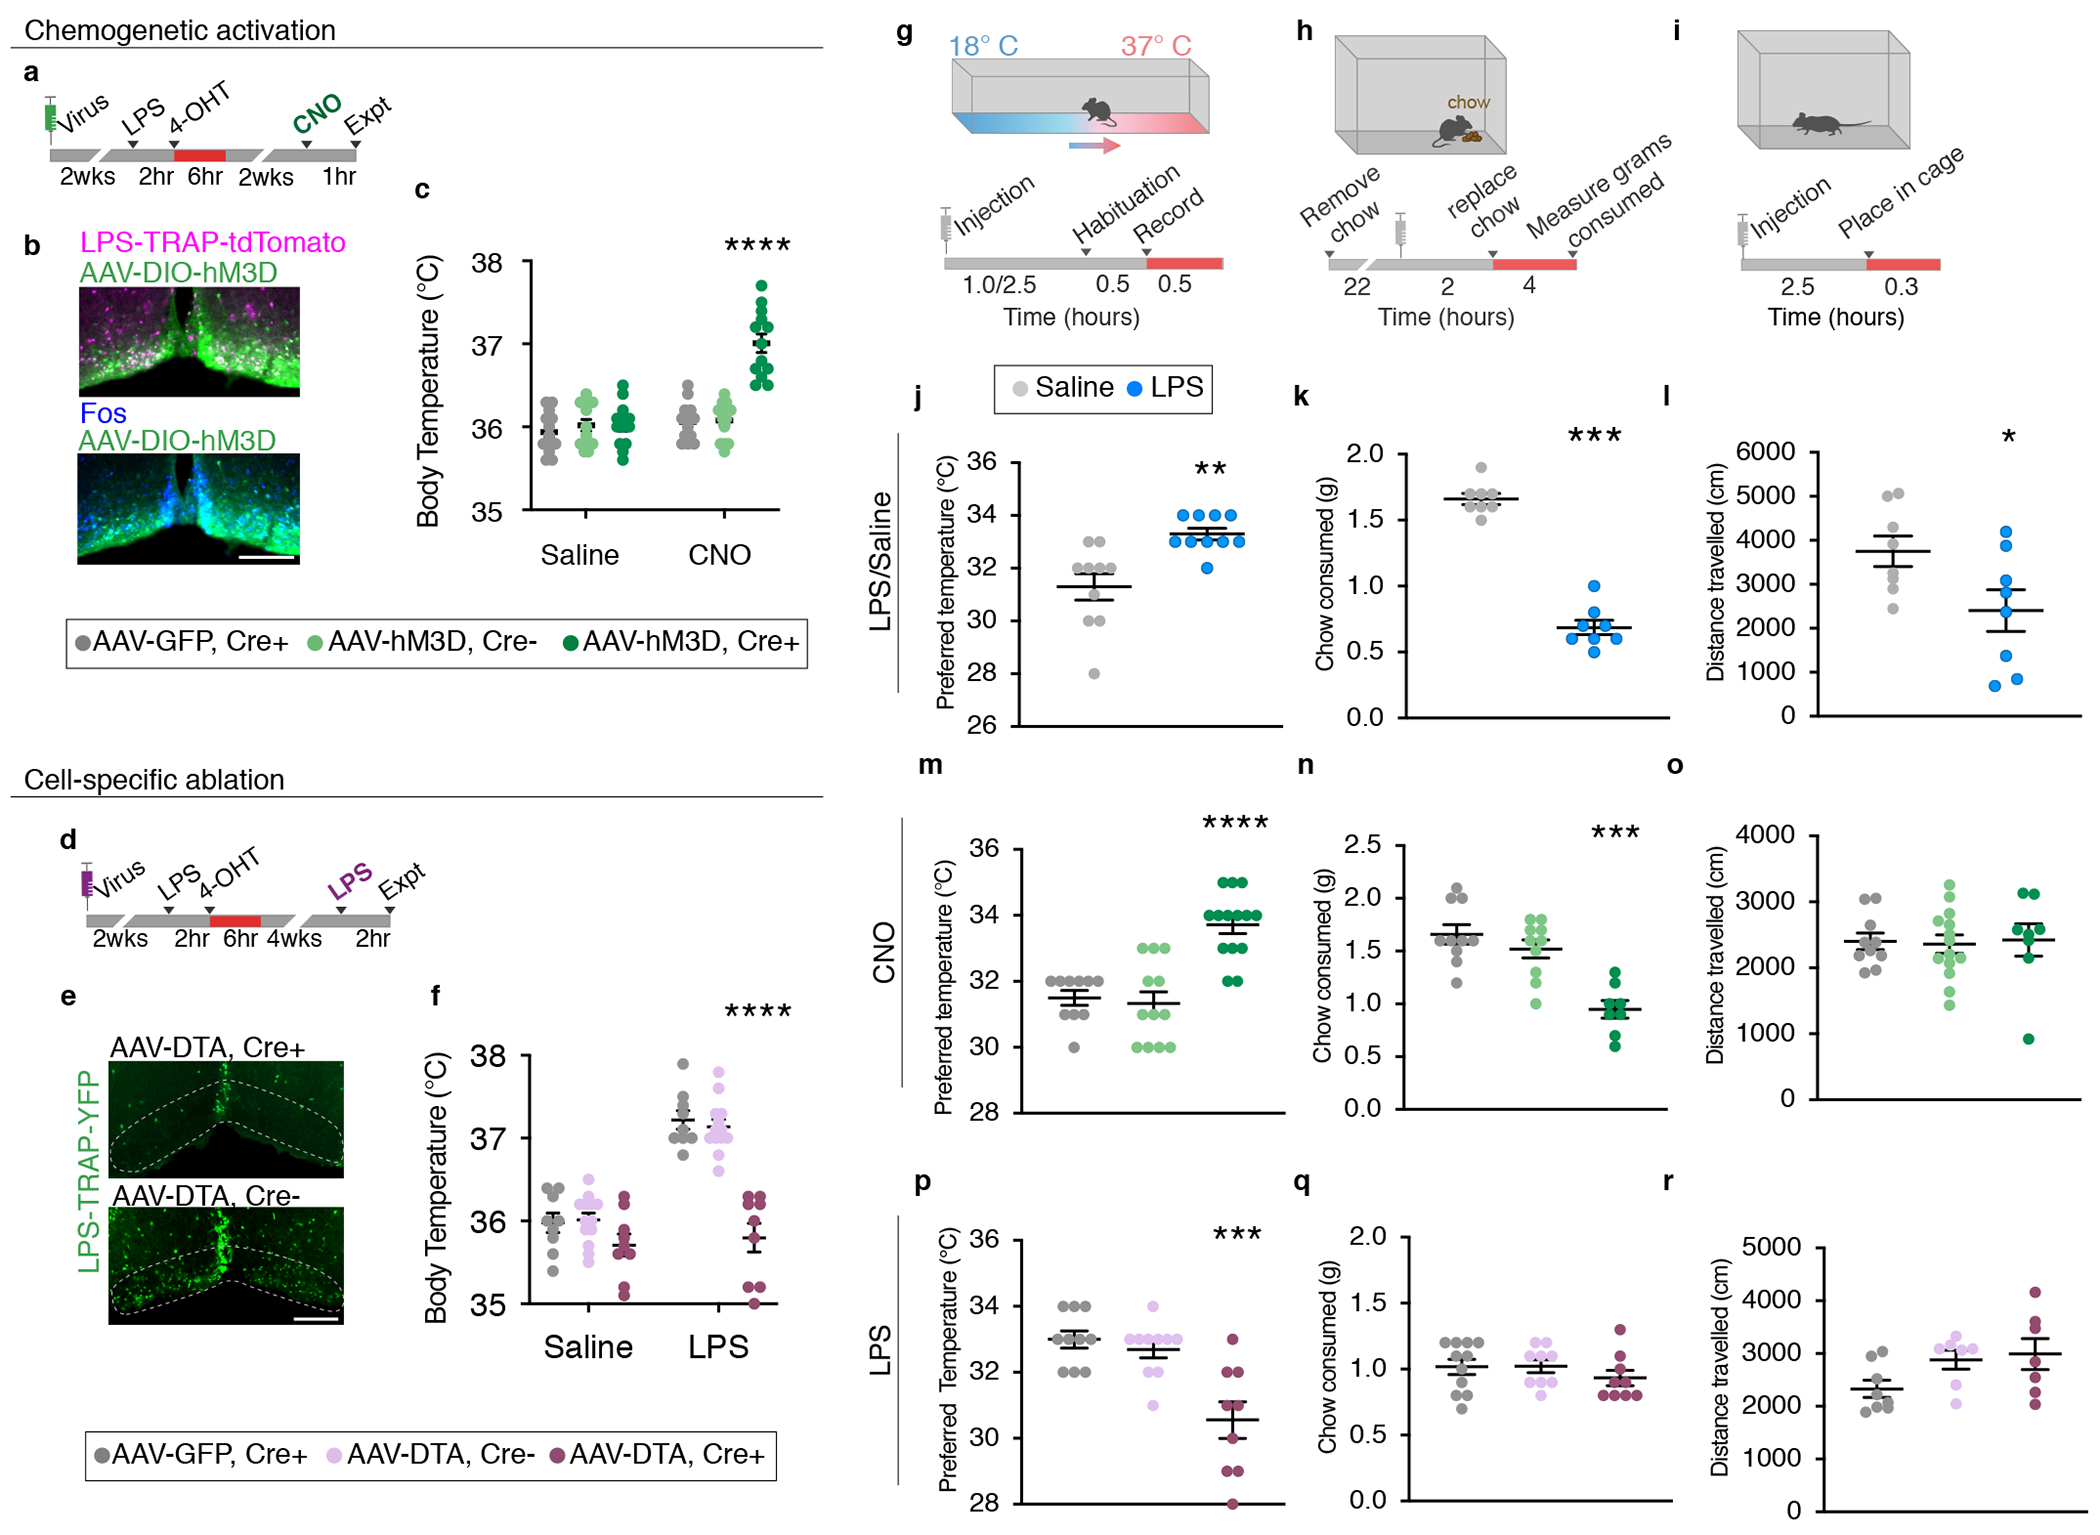
Figure 3. VMPOLPS neurons drive LPS-induced generation of fever, warmth-seeking behavior and appetite suppression.

(a) Experimental procedure for VMPOLPS chemogenetic activation. (b) Expression of chemogenetic activating receptor hM3D (green) in LPS-TRAP cells in the VMPO (magenta) and CNO-induced Fos expression (blue). (c) Mean body temperature post- saline or CNO injection in Cre+ mice expressing hM3D (dark green), Cre− mice expressing hM3D (light green) or Cre+ mice expressing GFP (grey) controls, Two-way ANOVA, p=<0.0001. (d) Experimental procedure for VMPOLPS cell ablation by diphtheria toxin (DTA). (e) LPS-TRAP cells (green) in the VMPO after cell ablation (top panel) compared to control (bottom panel). (f) Mean body temperature following saline or LPS injection in DTA-ablated mice (dark purple) and Cre− mice injected with AAV-DTA (light purple) and Cre+ mice expressing GFP (grey) controls, Two-way ANOVA, p=<0.0001. (g-i) Procedures to test sickness behaviors: temperature preference (g), change in appetite (h), change in locomotion (i). (j-l) Quantification of behavioral changes in wildtype mice following saline (grey) or LPS (blue) injection; (j) Median preferred external temperature, p=0.0016, (k) mean appetite, p=<0.0001, (l) mean locomotion, p=0.0372, n=8/group, two-tailed t-test. (m-o) Quantification of behavioral changes following CNO injection in mice with activated VMPOLPS neurons and controls; (m) preferred median temperature, p=<0.0001, (n) mean appetite, p=0.0007, (o) mean locomotion, Kruskal-Wallis Test with Dunn’s multiple comparison. (p-r) Quantification of behavioral changes in mice with ablation of VMPOLPS neurons and controls; (p) preferred median temperature, p=0.0002, (q) mean appetite, (r) mean locomotion, Kruskal-Wallis Test with Dunn’s multiple comparison. All scale bars = 200μm. See Statistics and Reproducibility section for precise n values. in All error bars = SEM.
