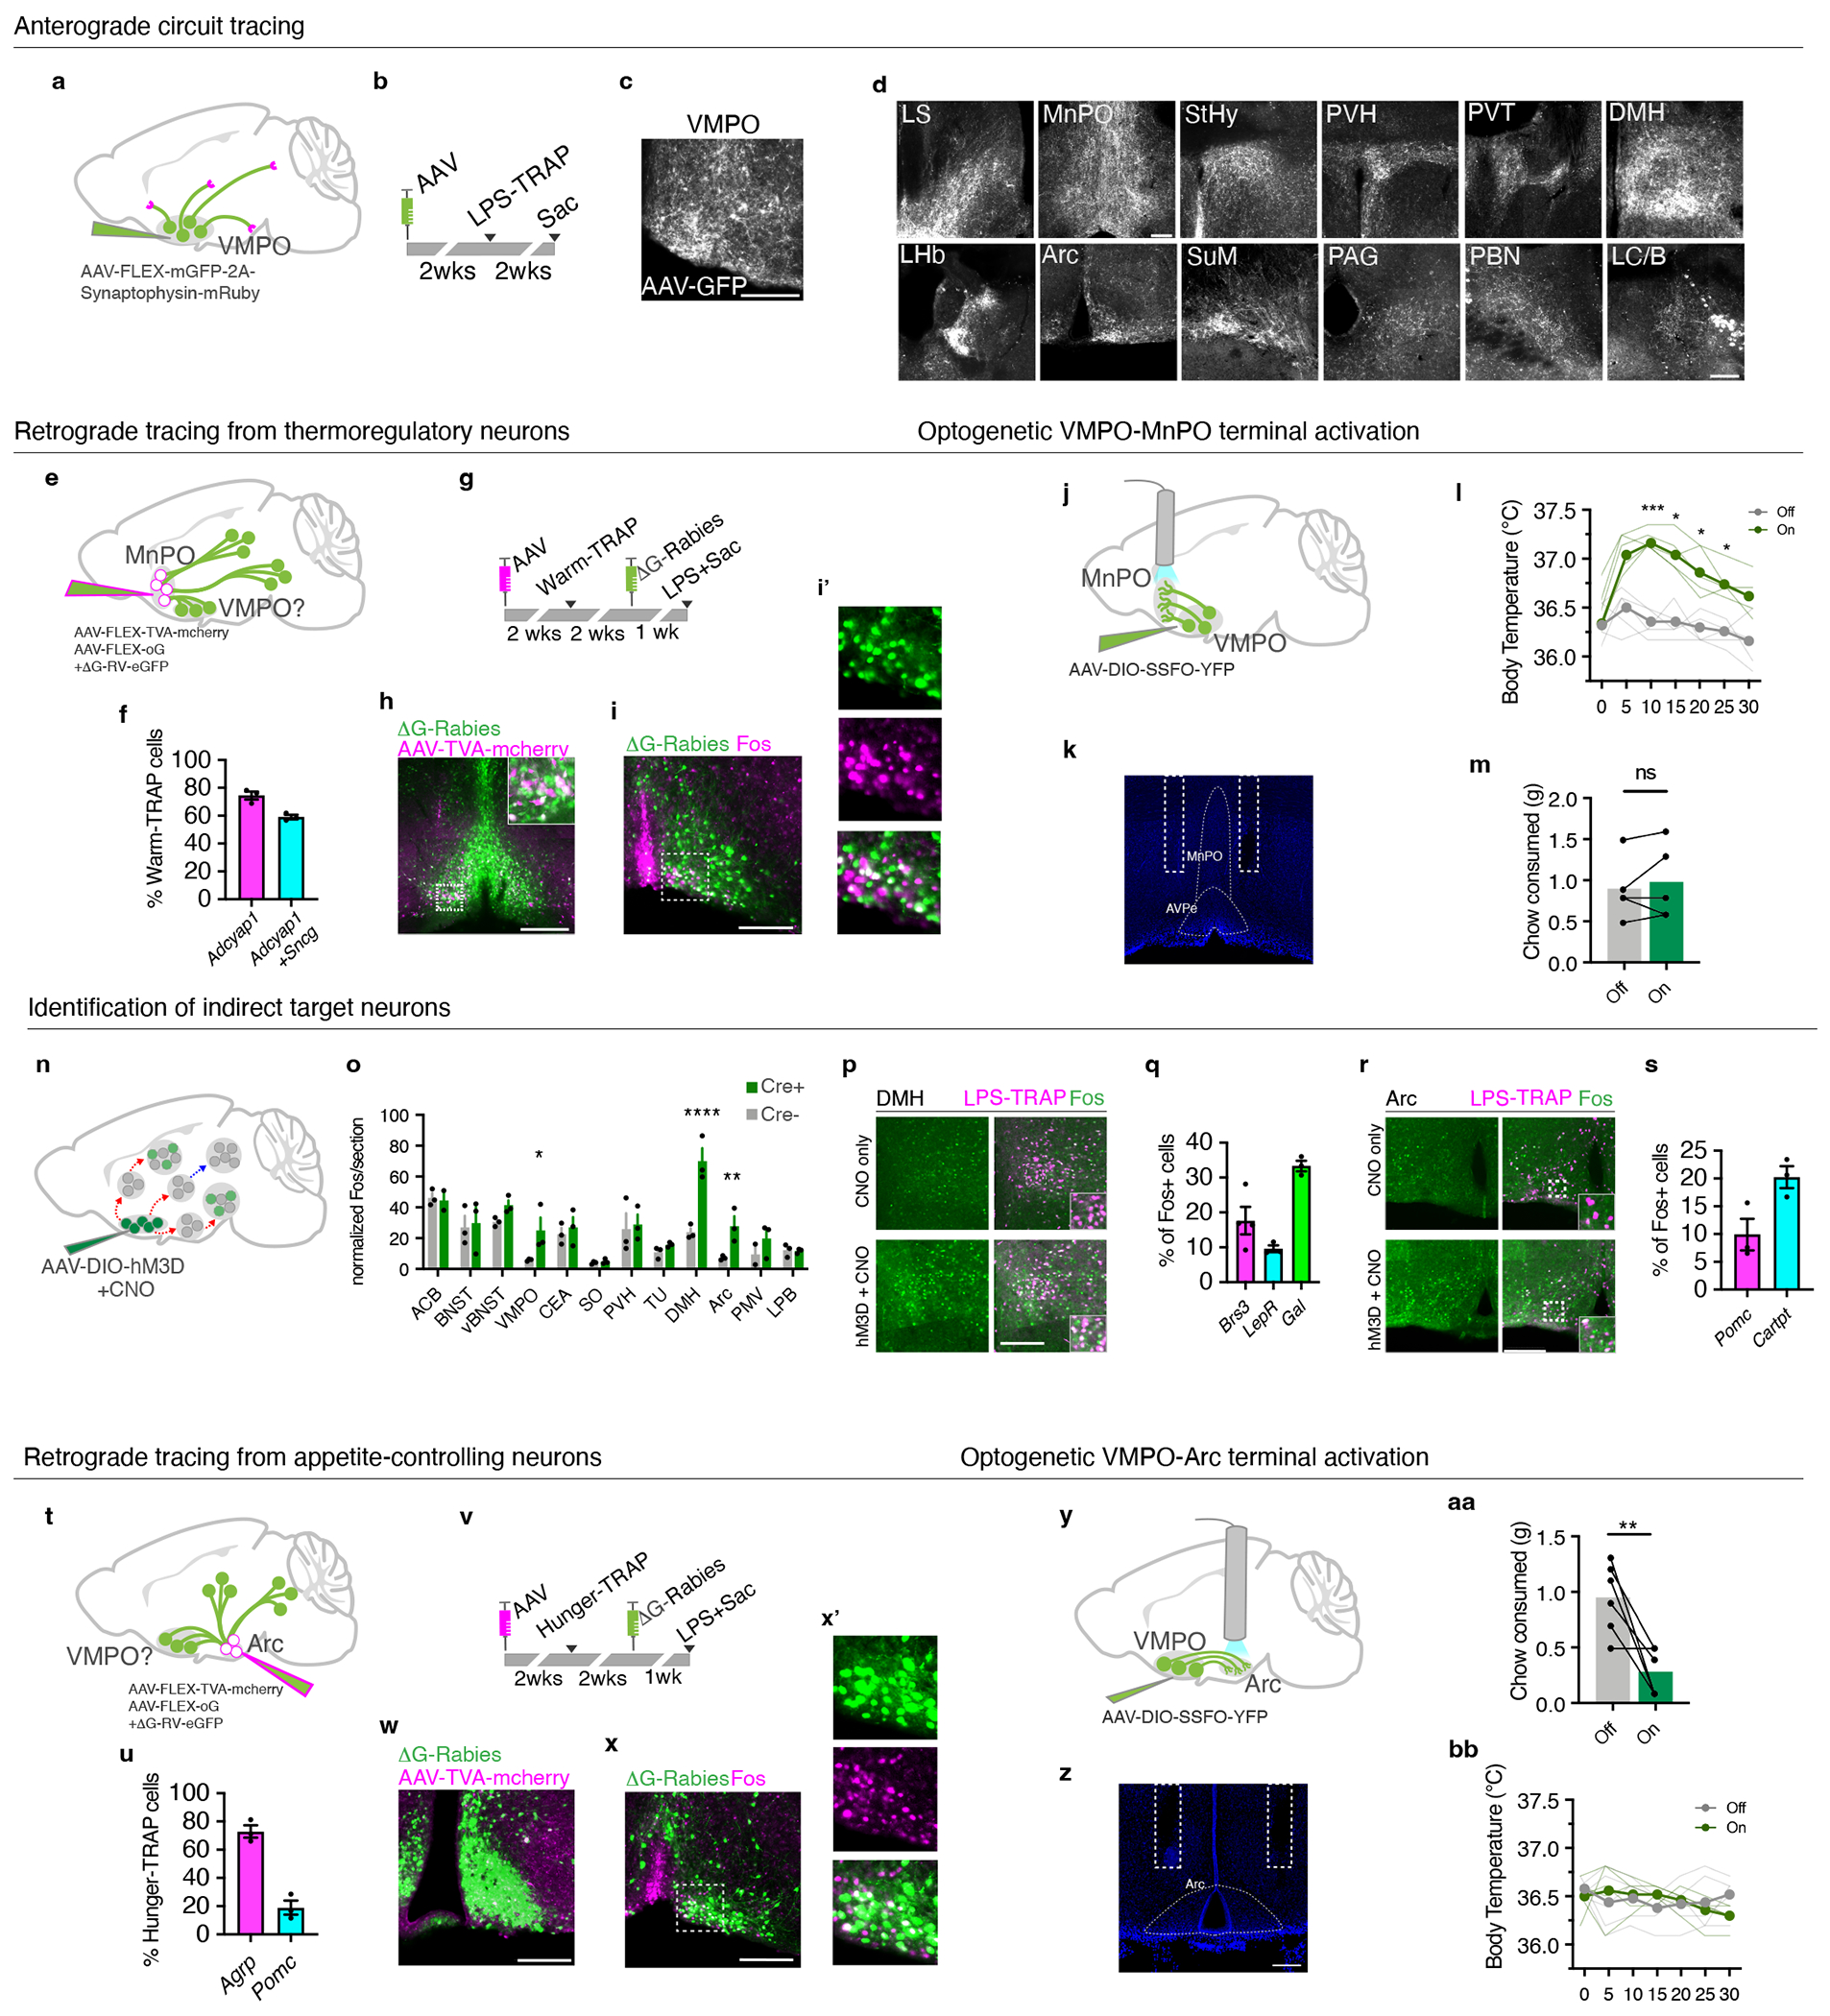
Figure 4. VMPOLPS neurons regulate body temperature and appetite through direct and indirect synaptic connections.

(a,b) Anterograde tracing from LPS-TRAP neurons in the VMPO(c). (d) Expression of GFP-labeled VMPOLPS axonal fibers, n=6 mice. (e) Retrograde tracing from warm-sensitive neurons in AVPe/MnPO (warm-TRAP). (f) Percent overlap of warm-TRAP neurons with adcyap1 and sncg, n=3. (g) Experimental timeline for retrograde tracing. (h) Starter cells in the AVPe/MnPO, green=g-deleted rabies, magenta=AAV-TVA-mcherry. (i) Overlap of rabies-infected input cells (green) and LPS-induced Fos (magenta). (i’) magnification of boxed region in (i). (j) Optogenetic activation of projections from VMPOLPS neurons to AVPe/MnPO. (k) Fiber placement. (l) Body temperature, stimulation (green) or no stimulation (grey) of VMPOLPS-AVPe/MnPO projections, light lines = individual mice, dark lines = mean, n=5, two-way ANOVA, * = p<0.05, ** = p<0.01, *** =p<0.001 (m) Chow consumed, n=5, ns=not significant, two-way Mann-Whitney test (n) Identification of downstream targets. (o) Mean Fos expression following CNO, n=3/group, two-way ANOVA, p=<0.0001 (p) Fos expression in LPS-TRAP neurons, control (top), VMPO activated (bottom). (q) Mean marker expression in DMH LPS-TRAP neurons, n=3 mice. (r) Fos expression following CNO. (s) Mean marker expression in LPS-TRAP neurons in the Arc, n=3 mice. (t) Retrograde tracing from appetite-controlling neurons in Arc. (u) Overlap of agrp and pomc in hunger-TRAP neurons, n=3/group. (v) Timeline of retrograde tracing. (w) Starter cells in the Arc. (x) Overlap of rabies-infected input neurons (green) and LPS-induced Fos (magenta). (x’) high magnification of (x). (y) Activation of VMPOLPS projections to Arc. (z) Fiber placement. (aa) Mean chow consumed following stimulation (on) or no stimulation (off) of VMPOLPS-Arc projections. dot-lines=individuals, n=6, p=0.0065, two-way Mann-Whitney test. (bb) Body temperature after VMPOLPS-Arc stimulation, (n=6). All scale bars = 200μm. All error bars = SEM.
