
Extended Data Figure 1. Specificity and identity of VMPOLPS neurons during inflammation.
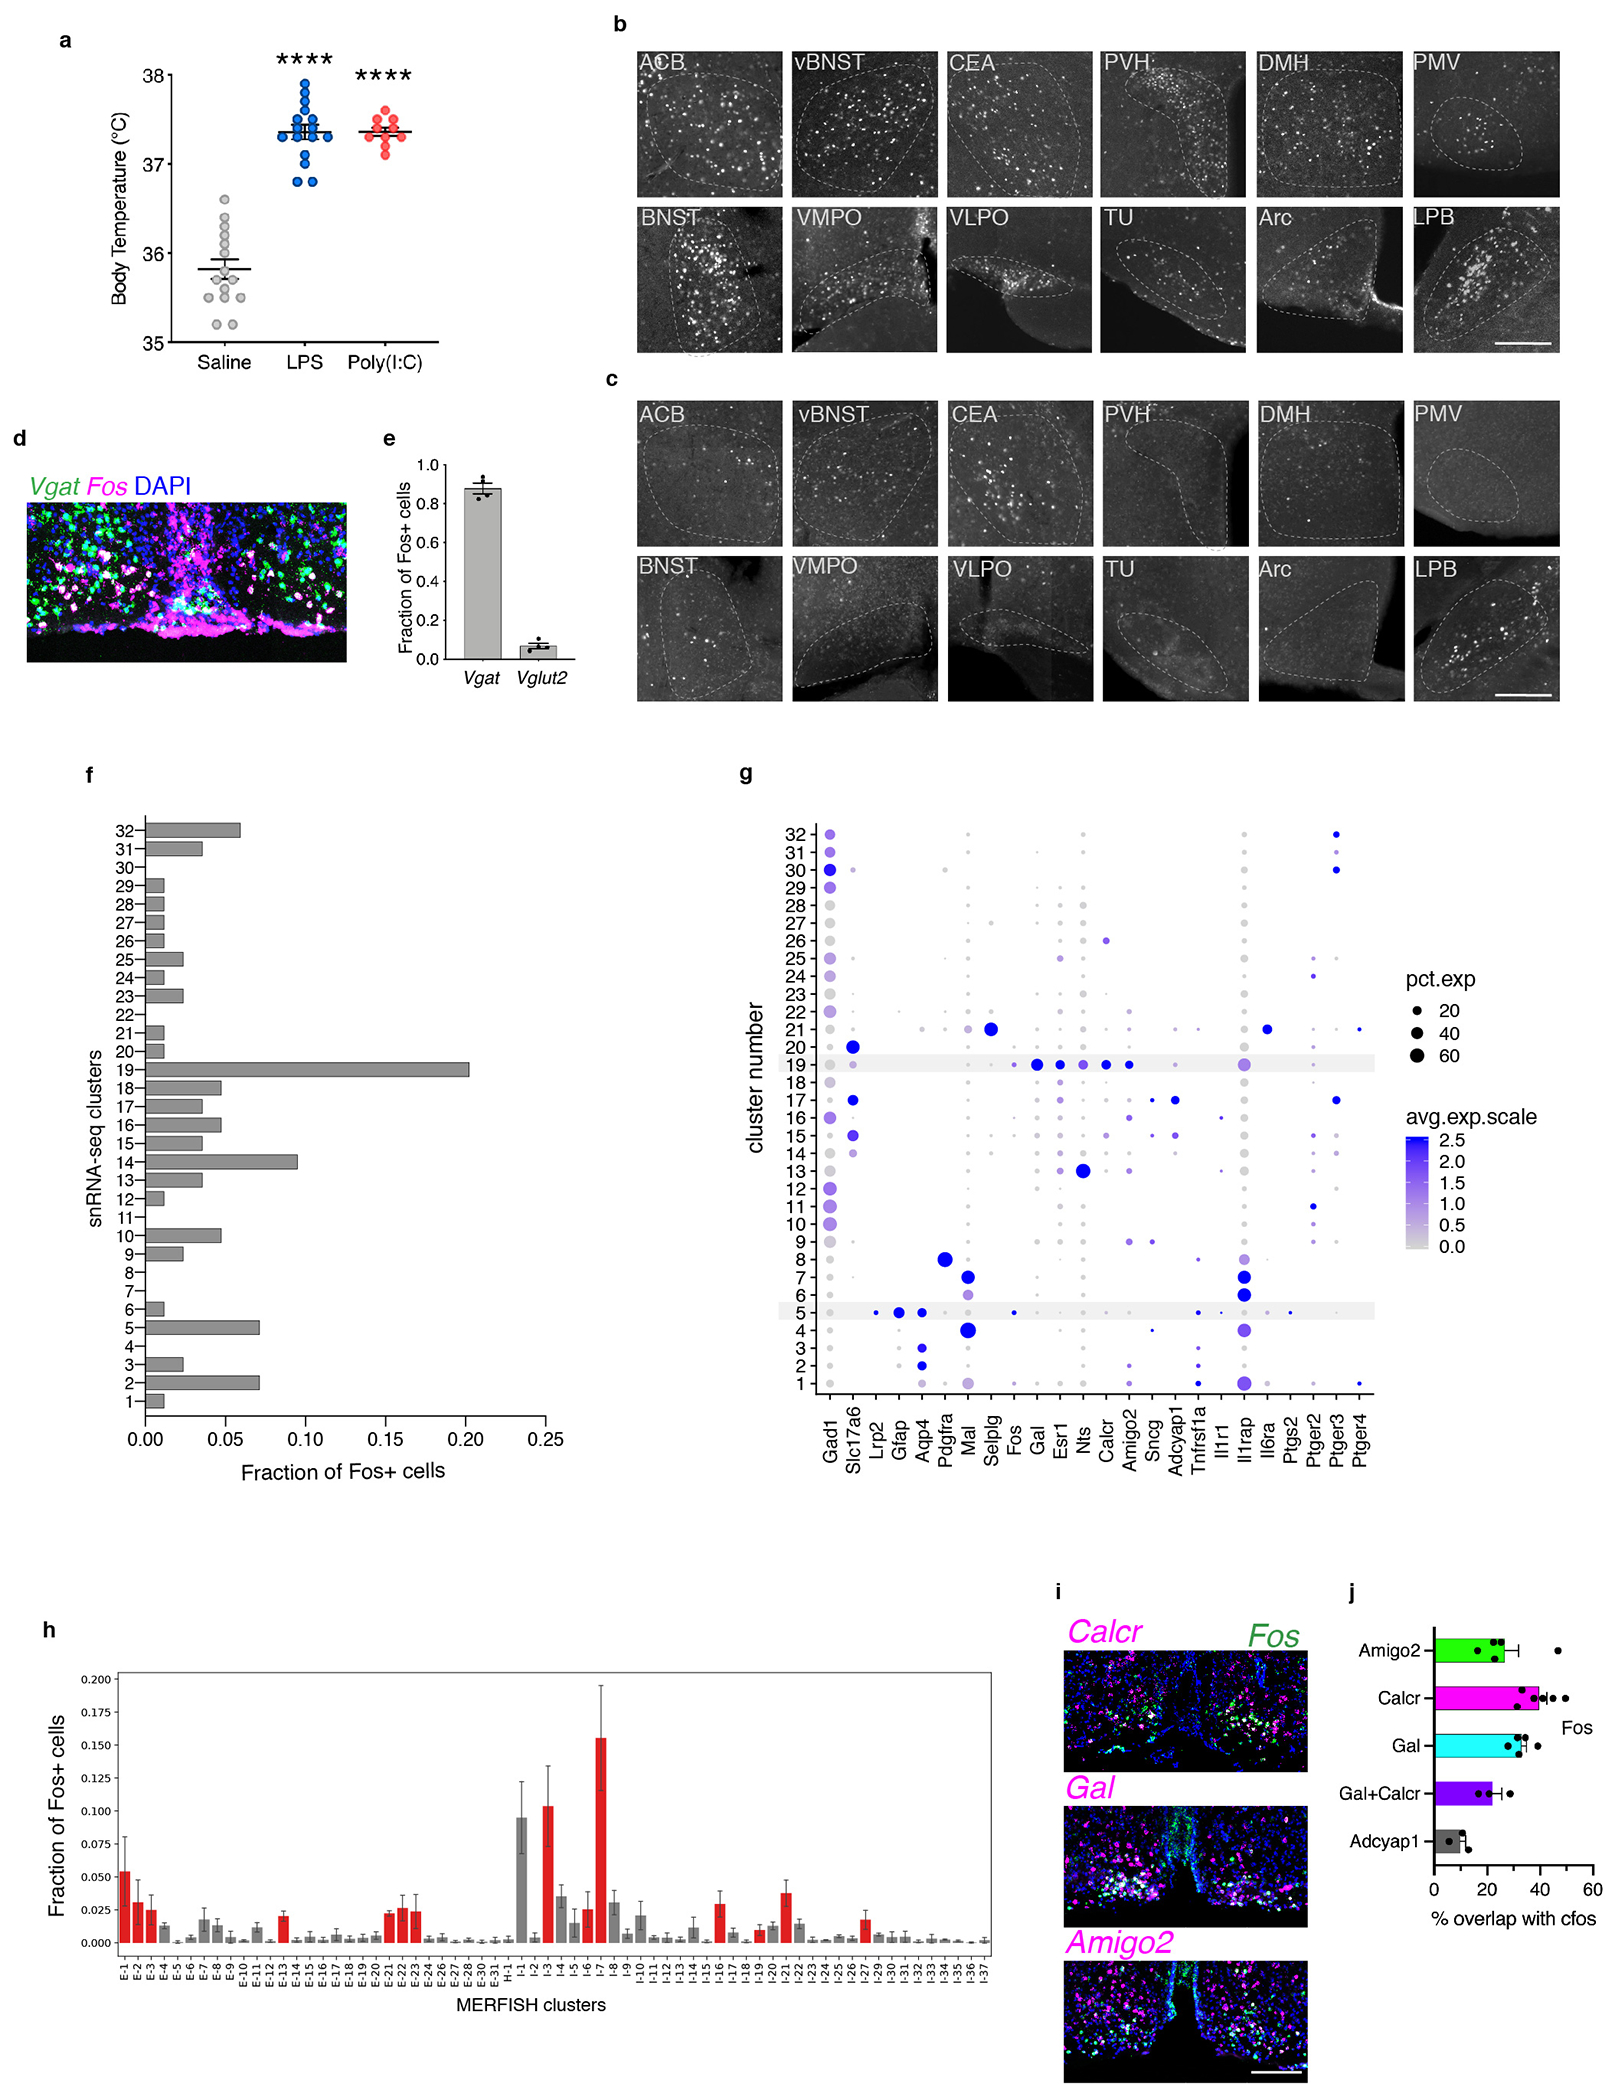
(a) Mean body temperature 2 hours following injection of saline (n=13), LPS (n=16) or Poly(I:C) (n=10). (b-c) Representative images of Fos expression in brain areas displaying significant increases in number of Fos+ cells following LPS administration (b) or saline (c), scale bar for all panels = 200μm. (d) mRNA expression of inhibitory neuronal marker Vgat (green) and Fos (magenta) in the VMPO after LPS injection. (e) Fraction of Fos+ cells that express Vgat or Vglut2 (n=4). (f) Quantification of the fraction of Fos+ cells within individual snRNA-seq clusters in LPS-injected sample. (g) Dotplot of average expression of marker genes and genes with immunological significance in each cluster: dot size indicates percent of cells in cluster with measurable expression and color indicates average expression levels; ependymal cluster cluster #5 and neuronal cluster #19, found significantly activated after LPS injection are highlighted in red. (h) Quantification of the fraction of Fos+ cells in individual MERFISH neuronal clusters, with statically significant enrichment for Fos+ cells indicated in red, n=3. (i) mRNA expression of markers for VMPOLPS neurons (calcR, gal and amigo2) in LPS-injected mice. (j) Mean of overlap of markers for VMPOLPS neurons and for warm-sensitive neurons (adcyap1) with LPS-mediated Fos expression in the VMPO, n=3 mice/experiment. All scale bars = 200μm. All error bars = SEM.