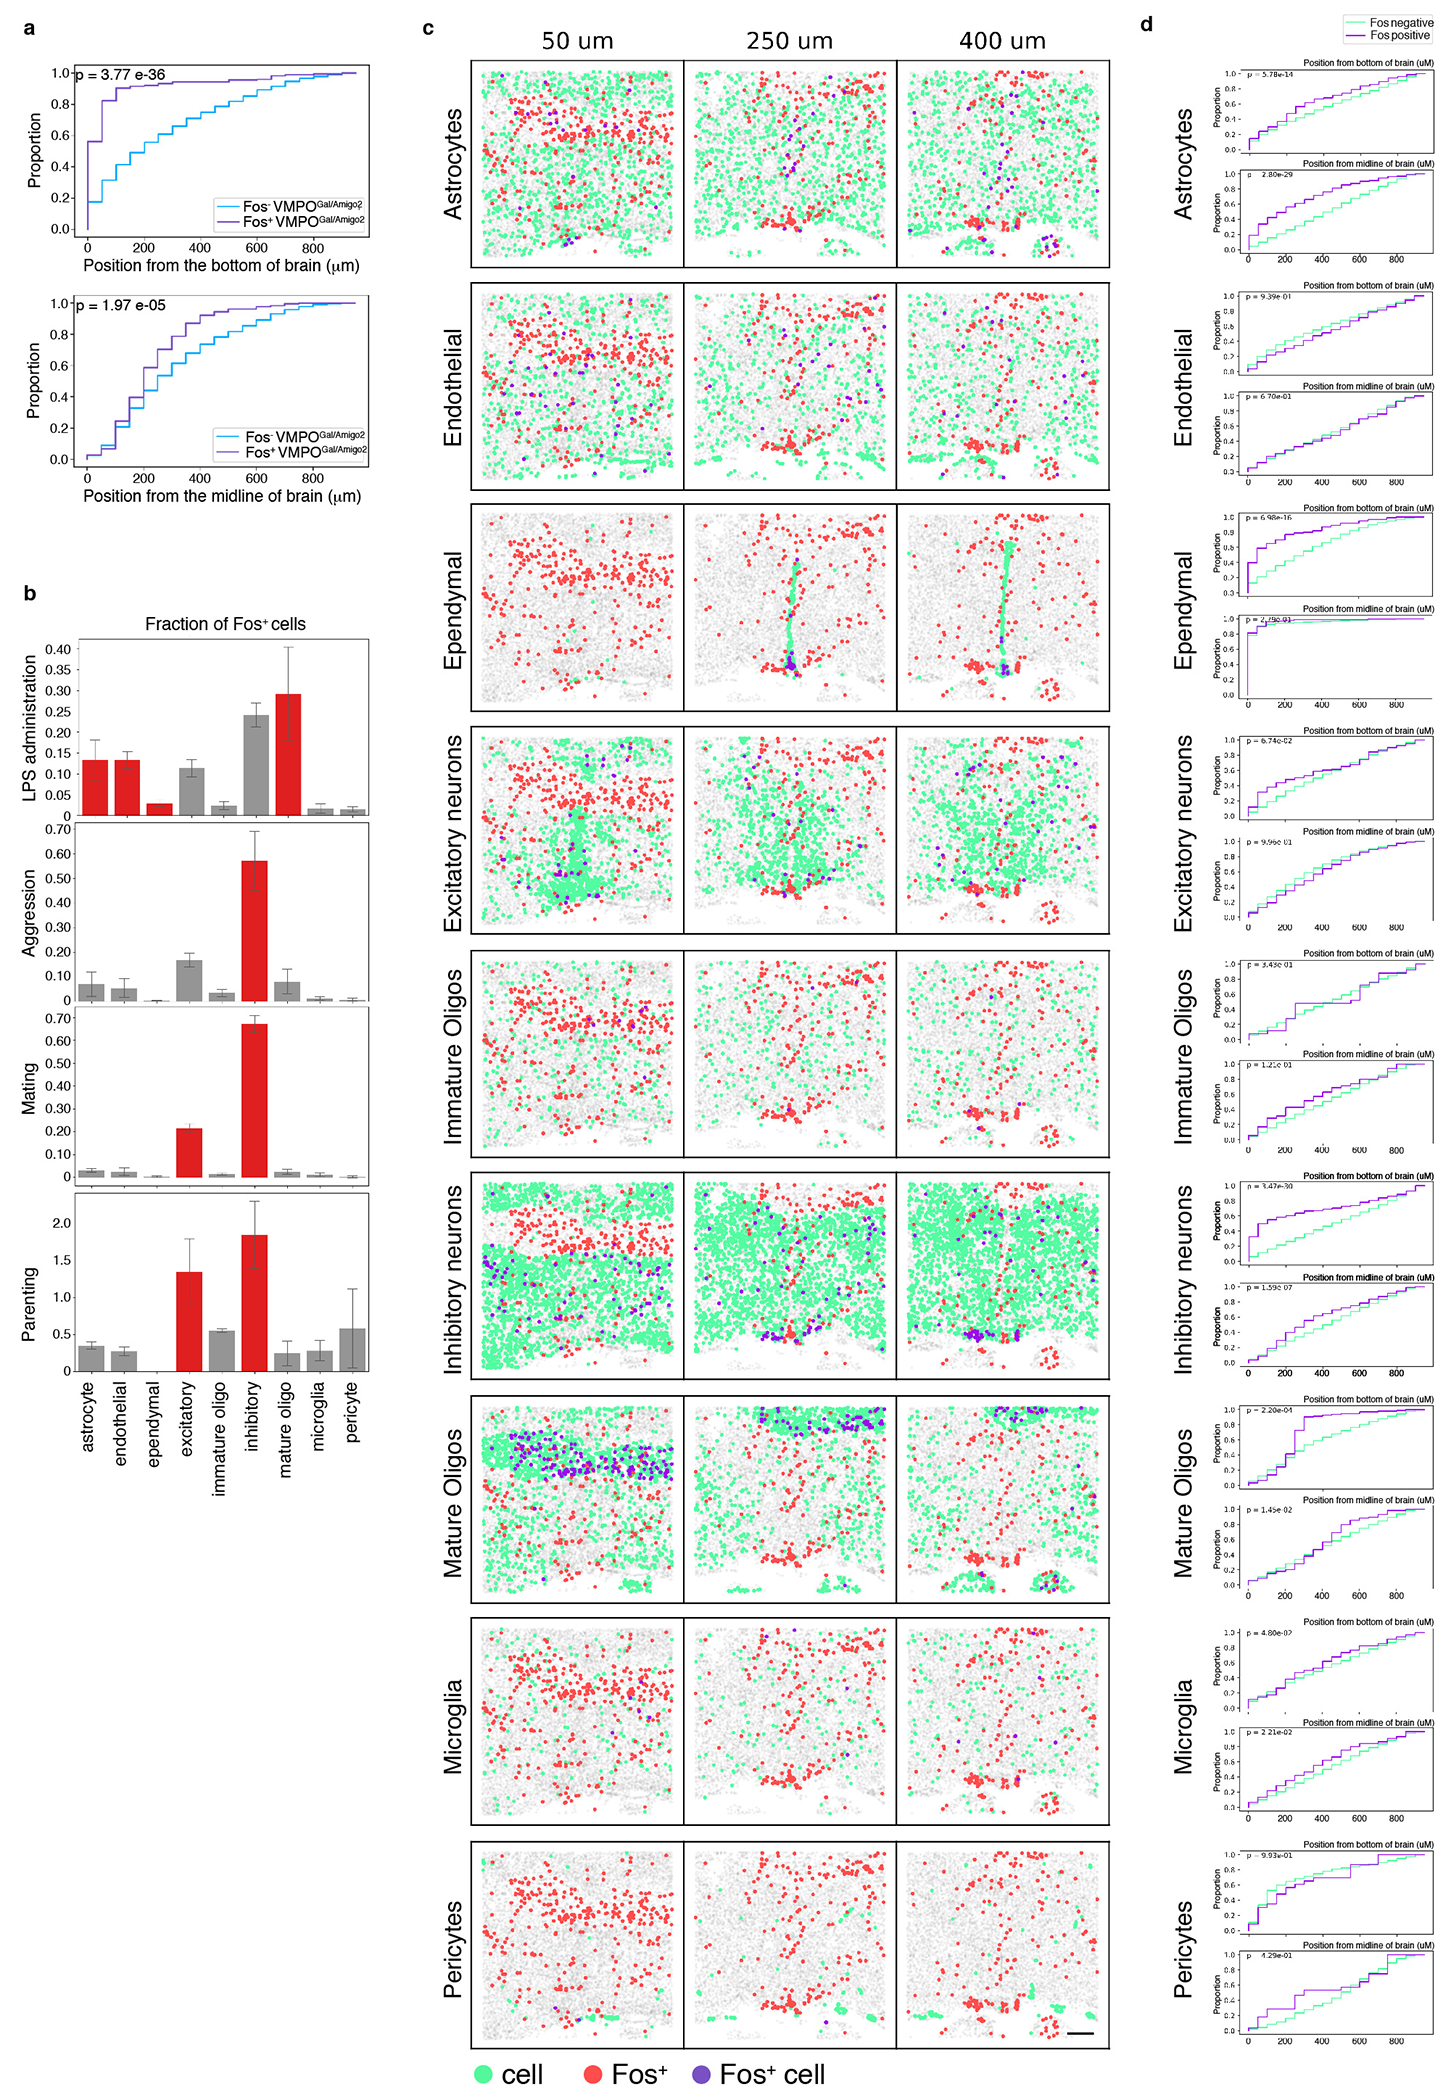
Extended Data Figure 2. Spatial distribution of activated neuronal and non-neuronal cell type classes in the preoptic area during inflammation.

(a) Cumulative distribution of Fos+ (purple) and Fos− (blue) VMPOGal/Amigo2 neurons as a function of the distance to the bottom of the section (top) or the midline (bottom), n=3 replicates. (b) MERFISH analysis indicating the fraction of Fos+ cells in major cell type classes in samples from mice injected with LPS versus mice displaying other behaviors: aggression, mating or parenting. Significantly activated populations are indicated in red. (c) Spatial distribution of major cell type classes in MERFISH analysis, cell type (green), Fos+ cell (red), Fos+ cells in the indicated cell type (purple). (d) Cumulative distribution of Fos+ (purple) and Fos− (green) cells in major cell type classes as a function of the distance to the bottom of the section (top) or the midline (bottom), n=3 mice. All scale bars = 200μm. All error bars = SEM.
