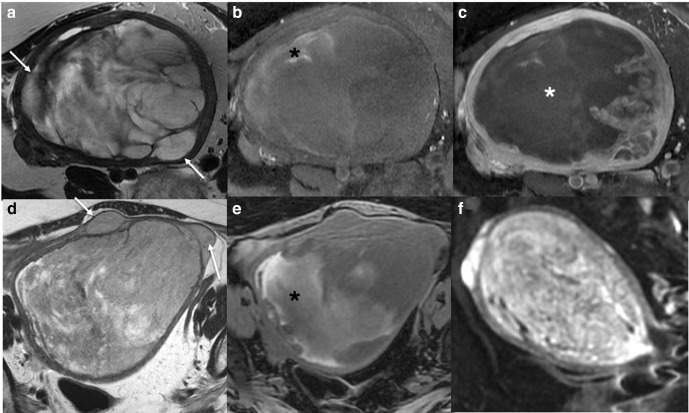
Figure 2.
Axial T2 (a) and T1 fat saturated image without (b) and with gadolinium contrast medium (c) MRI of a low grade ESS. The ESS demonstrates myometrial invasion with irregular nodular borders (a, white arrows), heterogenous T2 signal, intralesional haemorrhage (b, black *), and central poor enhancement (c, white *). Axial T2W (d), axial T1 fat saturated image (e) and DWI (f) MRI of a uterine adenosarcoma. The adenosarcoma demonstrates myometrial invasion with irregular borders (d, white arrows), heterogenous T2 signal, intralesional haemorrhage (e, black *), and restricted diffusion. (f). ADC maps not shown. ADC, apparent diffusioncoefficient; DWI, diffusion-weighted imaging; ESS, endometrial stromal sarcoma.

