Table 1.
In vitro anti-proliferative effects of the obtained compounds against HepG2 and MCF-7 cell lines. 
| Comp. No. | X | HBA-HBD | R |
In vitro IC50 (µM) a |
|
|---|---|---|---|---|---|
| HepG2 | MCF-7 | ||||
| 12a | H | -NH-CO- |

|
38.83 ± 3.2 | 33.27 ± 2.9 |
| 12b | Cl | -NH-CO- |

|
64.16 ± 6.1 | 77.03 ± 7.3 |
| 12c | CH3 | -NH-CO- |

|
74.30 ± 6.8 | 36.72 ± 3.3 |
| 12d | H | -NH-CO- |
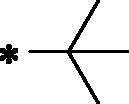
|
23.61 ± 2.1 | 44.09 ± 3.8 |
| 12e | Cl | -NH-CO- |
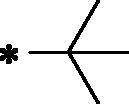
|
71.59 ± 6.7 | 62.29 ± 5.8 |
| 12f | CH3 | -NH-CO- |
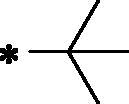
|
36.96 ± 3.4 | 22.54 ± 1.8 |
| 12g | H | -NH-CO- |
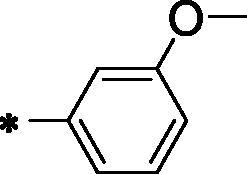
|
36.67 ± 2.9 | 53.01 ± 5.1 |
| 12h | Cl | -NH-CO- |
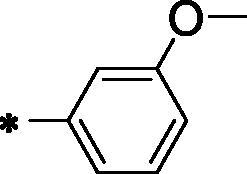
|
102.10 ± 8.5 | 85.62 ± 8.2 |
| 12i | CH3 | -NH-CO- |
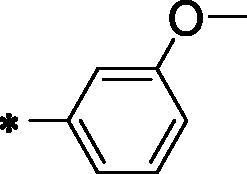
|
27.30 ± 2.2 | 27.99 ± 2.1 |
| 12j | H | -NH-CO- |
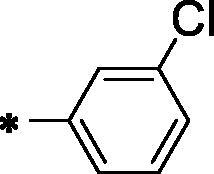
|
50.92 ± 4.6 | 33.61 ± 2.8 |
| 12k | Cl | -NH-CO- |
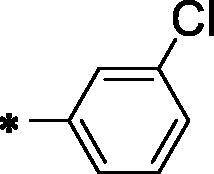
|
28.36 ± 2.5 | 86.62 ± 7.8 |
| 12l | CH3 | -NH-CO- |
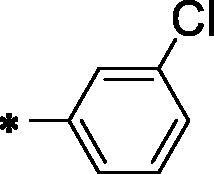
|
10.50 ± 0.8 | 15.21 ± 1.1 |
| 13a | H | -CO -NH-NH-CO- |
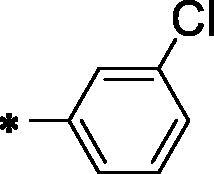
|
25.47 ± 2.1 | 32.47 ± 2.9 |
| 13b | Cl | -CO -NH-NH-CO- |
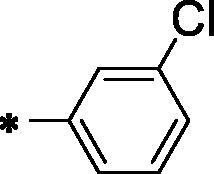
|
42.06 ± 3.8 | 26.31 ± 2.2 |
| 13c | CH3 | -CO -NH-NH-CO- |
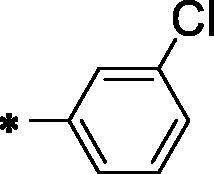
|
24.25 ± 2.1 | 53.13 ± 3.7 |
| Sorafenib | - | - | - | 5.57 ± 0.4 | 6.46 ± 0.3 |
aData are presented as mean of the IC50 values from three different experiments.
