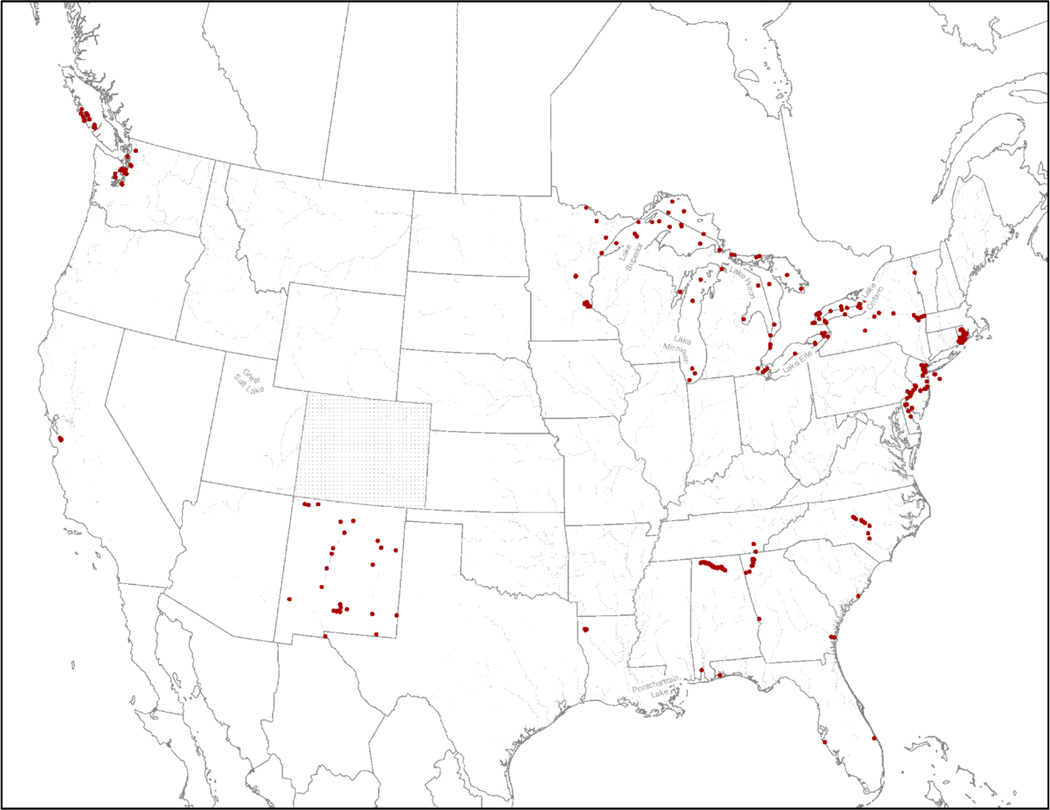
Figure 1.
Map indicating sampling locations for perfluorooctane sulfonate (PFOS) measured in surface waters across the United States (U.S.) based on data reported in the current, publicly available literature. Sampling locations for the Colorado data were not available and these data are represented by the dash marks to indicate measured PFOS surface water concentrations are available. Detailed information on sampling locations, including references, coordinates, and sampling site identification numbers and names, provided in Supplemental Data, Figure S1 and Table S1.

