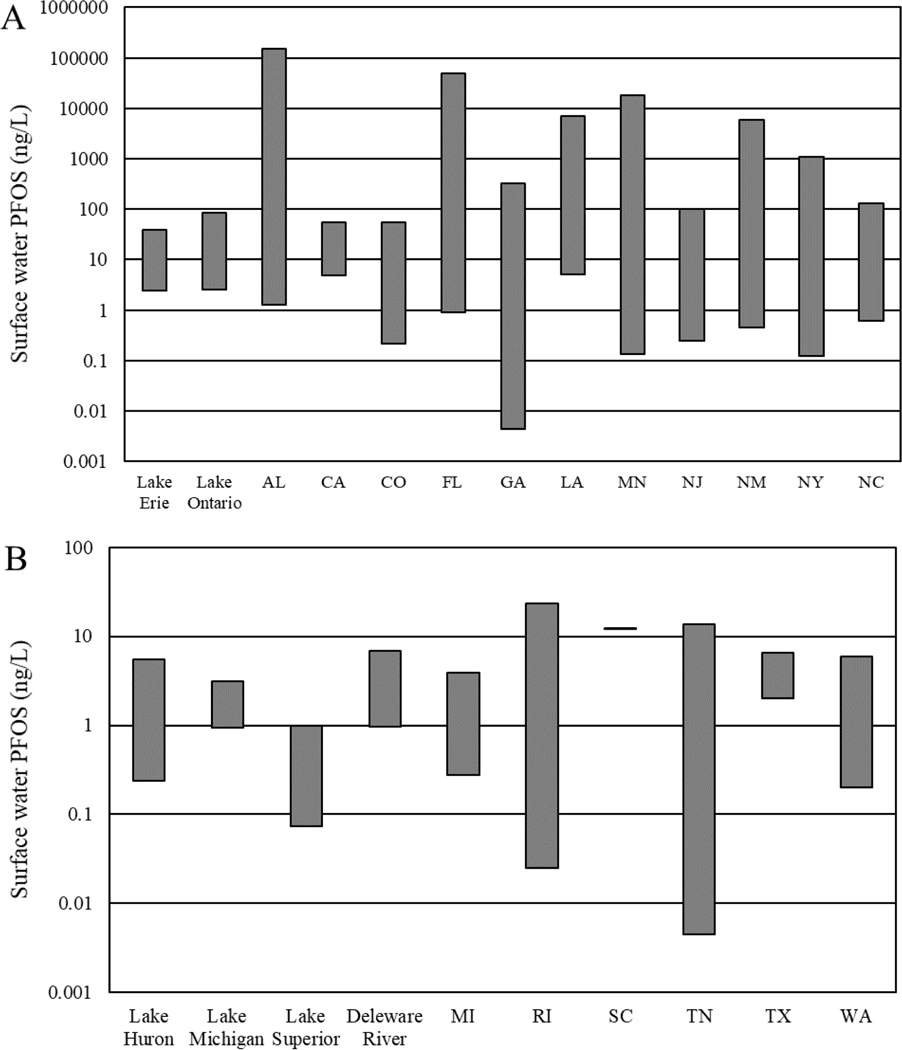
Figure 6.
Comparison of relatively high (A; greater than 30 ng/L) and low (B; less than 30 ng/L) maximum perfluorooctane sulfonate (PFOS) concentrations (ng/L) measured in surface water samples collected across the United States (U.S.) as reported in the current, publicly available literature and is not necessarily comprehensive of PFOS concentrations in surface waters across each state.. The relatively high PFOS concentrations were associated with specific nearby consumer and/or industrial source. Both distributions are arranged alphabetically by waterbody or state.

