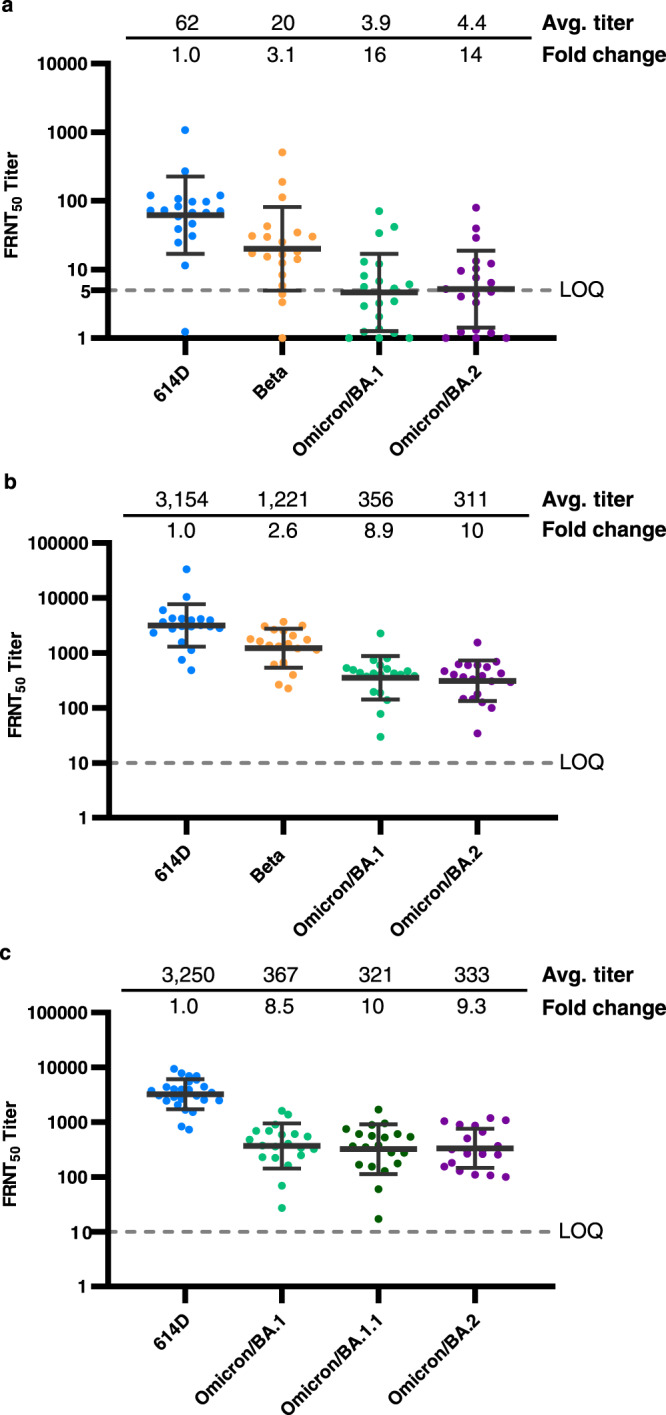
Fig. 3. Neutralizing activity of mRNA vaccinee sera (pre- and post-booster) against live SARS-CoV-2 viruses.

Each dot represents the neutralizing titer (FRNT50) of an individual serum sample against a specific SARS-CoV-2 virus, which is labeled on the X-axis. Different colors represent the progenitor virus or different variants and subvariants. The geometric mean FRNT50 titers are represented in the graph as bars on top of the dots with geometric standard deviation. The geometric mean FRNT50 titers (avg. titer) and average fold changes relative to reference virus 614D (set as 1-fold) are shown on the top of the graph. Dashed line represents the limit of quantitation (LOQ). For statistical analysis, a two-tailed Wilcoxon matched-pairs signed-rank test was performed by comparing each variant with 614D. Test statistics and P value are summarized in Supplementary Table 2. Source data are provided as a Source Data file. a 614D, Beta, and Omicron subvariants BA.1 and BA.2 reporter viruses were tested. N = 20 biologically independent pre-booster sera (6–7 months post-second dose). The average fold changes of all variants differ significantly (P < 0.0001) from 614D. LOQ = 5. b 614D, Beta and Omicron subvariants BA.1 and BA.2 reporter viruses were tested. N = 20 biologically independent post-booster sera (2–6 weeks post-third dose). The average fold changes of all viruses differ significantly (P < 0.0001) from 614D. LOQ = 10. c 614D and Omicron subvariants BA.1, BA.1.1, and BA.2 isolated from clinical specimens were tested. N = 20–25 biologically independent post-booster sera examined over four viruses. The average fold changes of all viruses differ significantly (P < 0.0001) from 614D. LOQ = 10.
