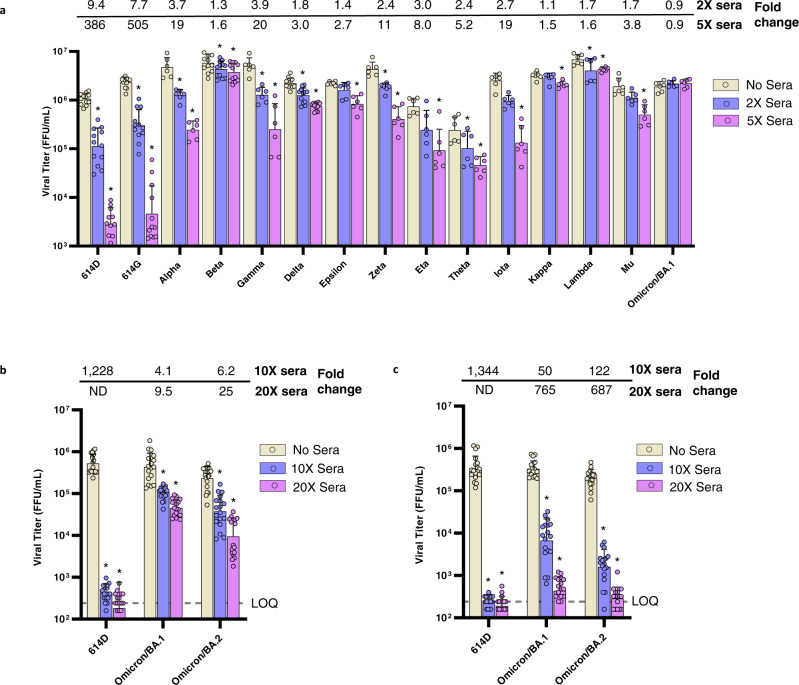
Fig. 5. Inhibition of mRNA vaccinee sera against live SARS-CoV-2 viruses.
Calu-3 cells were infected with 200–400 focus forming units (FFU) of each virus and incubated for 2 days in media with or without sera. The viruses were collected from Calu-3 supernatant at 2 days post inoculation and titrated by FFU assay. The geometric mean viral titers of variants under different treatment conditions are represented in the graph as bars with geometric standard deviation. Bar graphs present the titers of each variant under different treatment conditions. Error bars representing titer differences are marked as *, representing p < 0.05, compared to the no sera control within each virus group. Two-tailed Wilcoxon matched-pairs signed-rank test was used for statistical significance analysis and the statistics and P value are summarized in Supplementary Table 2. Source data are provided as a Source Data file. Titer fold changes (reductions) compared to the no sera control are shown on the top of the panel. a The sera for incubation were pooled from the individual sera used in Fig. 2a and diluted to 2X or 5X concentration (diluted sera titer FRNT50 = 2 or 5 against 614D reference virus). N = 6 or 12 viral titers over 2 biologically independent sera pools in 1–2 independent experiments. b The sera for incubation were pooled from the individual sera used in Fig. 2a (post-second dose) and diluted to 10X or 20X concentration (diluted sera titer FRNT50 = 10 or 20 against 614D reference virus). N = 18 viral titers over 2 biologically independent sera pools in 1–2 independent experiments. The fold change for the 614D-20X sera group is not determined (ND) as the average viral titer of that group is below the LOQ. c The sera for incubation were pooled from the individual sera used in Fig. 3b (post-third dose) and diluted to 10X or 20X concentration (diluted sera titer FRNT50 = 10 or 20 against 614D reference virus). N = 18 viral titers over 2 biologically independent sera pools in 1–2 independent experiments. The fold change for the 614D-20X sera group is not determined (ND) as the average viral titer of that group is below the LOQ. Yellow bars, viral titers in the absence of sera; blue bars, viral titers in 2X or 10X sera; purple bars, viral titers in 5X or 20X sera. Limit of quantification LOQ = 240 FFU/mL.

