Figure 3.

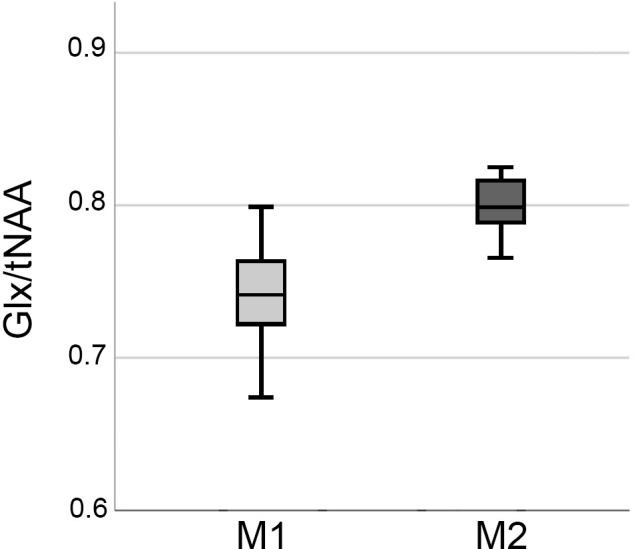
Boxplots showing elevations in Glx/tNAA ratio in the right caudal middle frontal area before (M1) and after the treatment period (M2). Glx, combined measure of glutamate and glutamine; tNAA, total N-acetylaspartate.

Boxplots showing elevations in Glx/tNAA ratio in the right caudal middle frontal area before (M1) and after the treatment period (M2). Glx, combined measure of glutamate and glutamine; tNAA, total N-acetylaspartate.