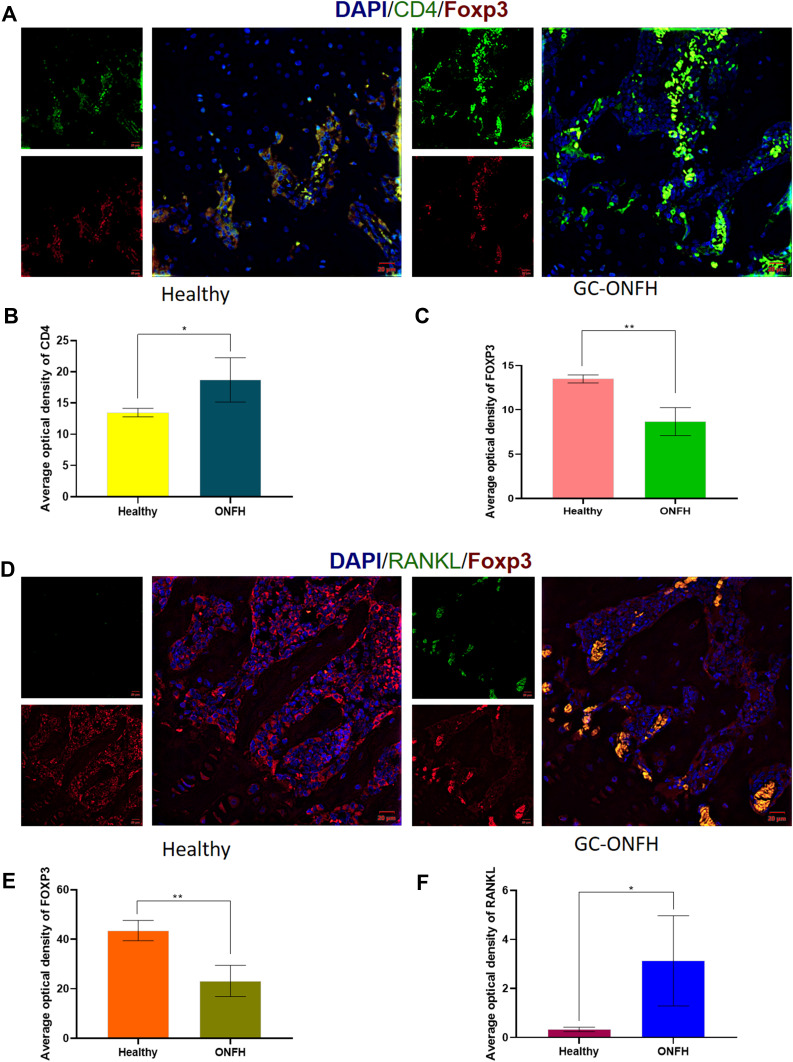
Figure 2.
(A) Immunofluorescence assay for CD4 and FOXP3 stained lymphocytes in the bone marrows of healthy and GC-ONFH. (B and C) Statistical analysis depicting the mean optical density (MOD) of specific indicators in different study groups. (D) Immunofluorescence assay for FOXP3 and RANKL stained lymphocytes in the bone marrows of healthy and GC-ONFH. (E and F) Statistical analysis depicting the mean optical density (MOD) of specific indicators in different study groups. Data represent the mean ±SD. *P <0 0.05 and **P<0.01 compared with healthy controls.

