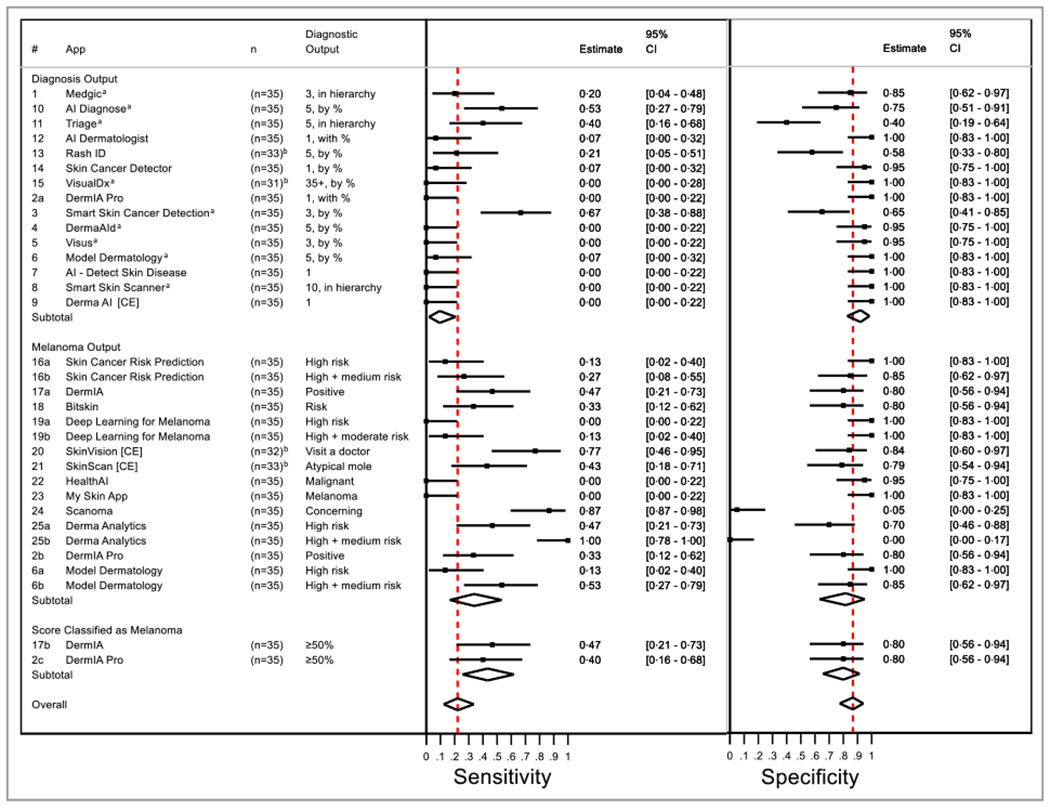
Figure 1.

Forest plots of sensitivity and specificity of commercially available AI smartphone applications for the detection of melanoma, by output category; dotted red line represents overall mean. Paired forest plots with 95% confidence intervals (CI) were estimated using multi-level mixed-effects logit models and the ‘midas’ command in Stata v16.1 (Stata Statistical Software, StataCorp, College Station, TX, USA). For diagnosis-based apps, top-1 sensitivity and specificity are presented. Accuracy = TP + TN/TP + FP + TN + FN; sensitivity = TP/TP + FN; and specificity = TN/TN + FP; where TP = true positive, TN = true negative, FP = false positive, and FN = false negative. The number of diagnoses presented by the app is shown in the ‘Diagnosis Output’ output column, ordered in a hierarchy or by percentage probability (%) for a given diagnosis. For risk-category-based apps the categories interpreted as ‘Melanoma Output’ are presented. For continuous score-based apps the score classified as melanoma is presented. Apps 1, 2a, 2b, 4, 11, 15, 20 and 21 required metadata; 2, 6 and 17 had >1 output type; 20 was based on initial outputs, images later rejected. aRejected at least one image. bShows top-1 accuracy. Top-3 accuracy is presented in the manuscript.
