
FIGURE 4.
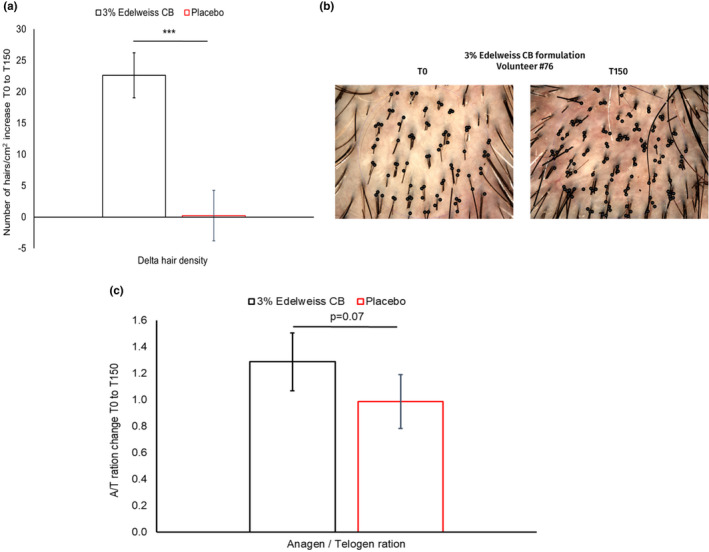
Effect of EWDE on hair density and anagen‐to‐catagen/telogen ratio in vivo. (a) Hair density was measured by Trichogram® from baseline to T150 and compared between the group using the 3% Edelweiss CB formulation (black bar) and the group using the placebo formulation (red bar). ***p < 0.001 vs placebo by ANOVA and post hoc Tukey’s test. Error bars represent the standard error of the mean (n = 30 per group). (b) Microimages of scalp showing hairs (black dots) at the baseline T0 and at the end of the study T150 of one volunteer, #76, using the active formulation with Edelweiss. (c) Hair follicles were analysed using TrichoScan®. The result was a comparison between the group using the 3% Edelweiss formulation (black bar) and the group using the placebo formulation (red bar). Error bars represent the standard error of the mean. The Mann–Whitney U test was used for statistics (n = 30 per group) [Colour figure can be viewed at wileyonlinelibrary.com]