
FIGURE 6.
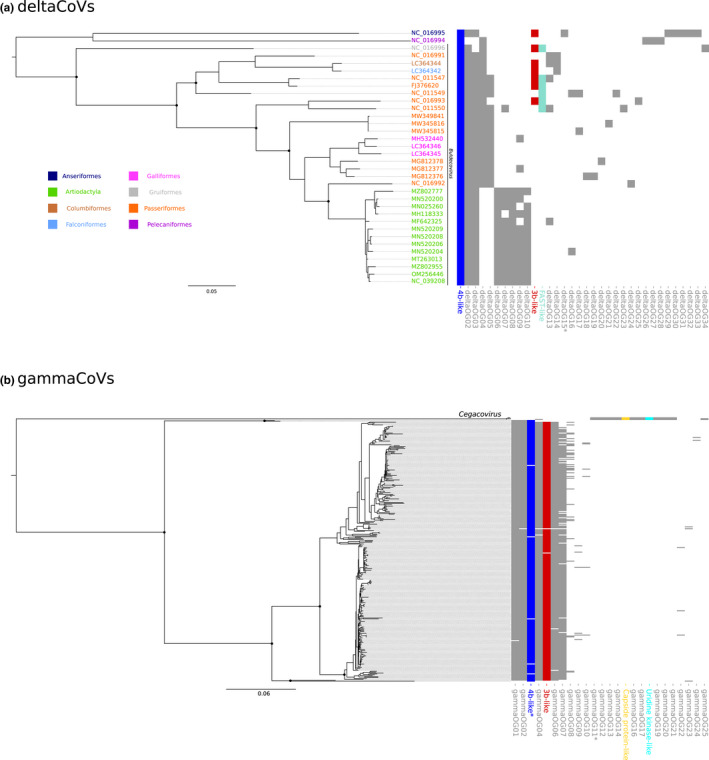
DeltaCoV and GammaCoV phylogeny and orthogroup distribution. Maximum‐likelihood phylogenetic tree of the RdRp region of deltaCoV (a) and gammaCoV (b) generated by iq‐tree using the LG + G4 and JTT + F + R6 models. Relevant internal nodes with bootstrap values >80% are shown as black dots. Super‐groups and relevant orthogroups are shown with the same colours as in Figure 3; unknown orthogroups are coloured in grey. Asterisks indicate orthogroups with split/paralogous ORFs. Scale bars are expressed as substitutions per site