Figure 1.

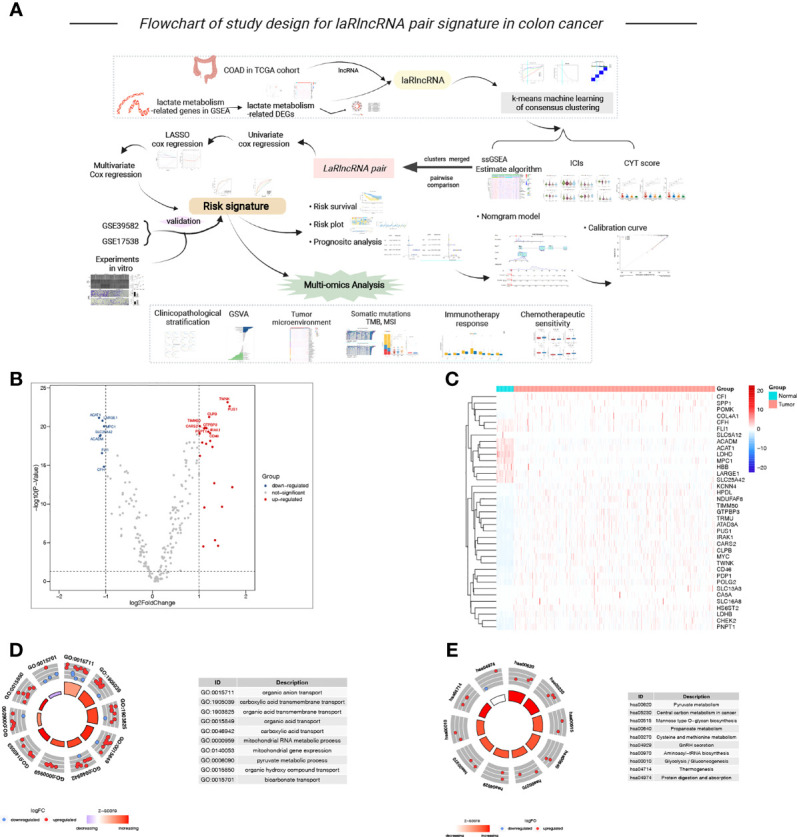
(A) Flowchart of our study, (B, C) The volcano plot and heatmap of lactate metabolism-related DEGs between tumor and normal samples, (D, E) The GO and KEGG circle plot of functional enrichment analysis.

(A) Flowchart of our study, (B, C) The volcano plot and heatmap of lactate metabolism-related DEGs between tumor and normal samples, (D, E) The GO and KEGG circle plot of functional enrichment analysis.