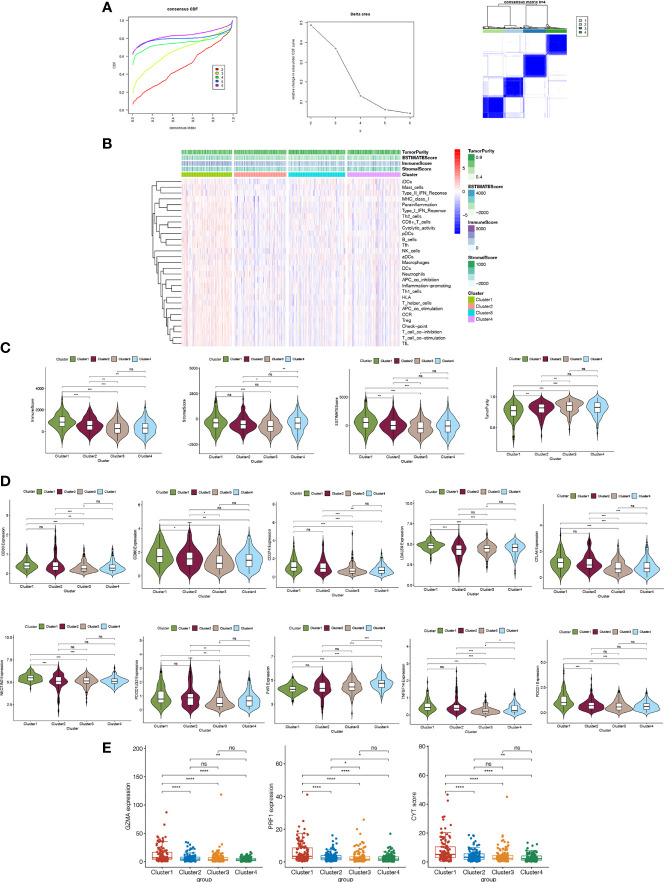
Figure 2.
(A) Consensus clustering CDF of k=2 to 6; Delta area under the CDF curve; Consensus clustering matrix of k=4. (B) Heatmap illustrating the relationships of four clusters and different immnue features (C) Immune, stromal, estimate scores and tumor purity using ESTIMATE (D) The expression of immune checkpoint genes in different clusters (E) The correlations of GZMA, PRFI gene expressions and CYT scores with clusters.

