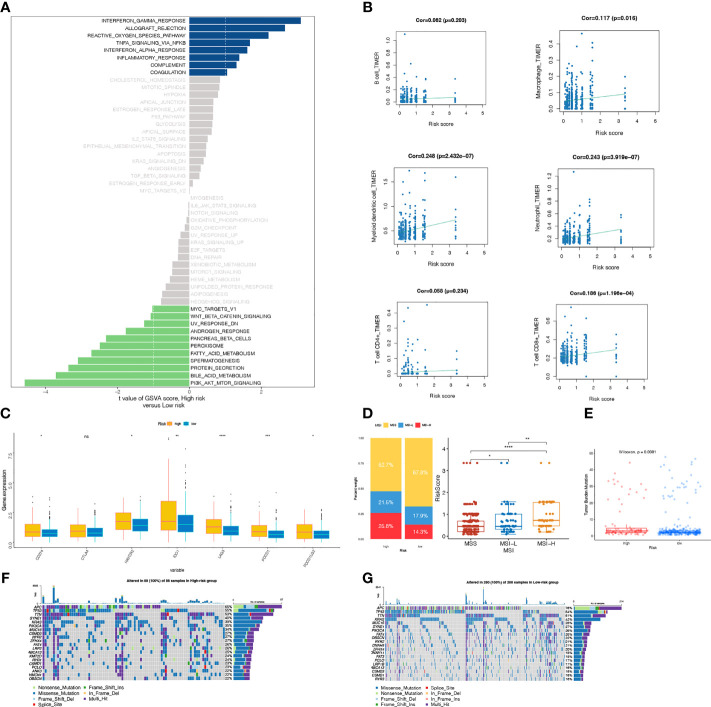
Figure 6.
(A) GSVA analysis (B) Spearman correlation analysis between the signature and six immune cells (B cell, Macrophage, Myeloid dendritic cell, Neutrophil cell, T cell CD4+ T cell CD8+) ; (C) The comparison of PDCDl, PDCD1LG2, LAG3, HAVCR2, CD274,IDO1 and CTLA-4 expression levels between high-risk and low-groups; (D) Relationships between risk score and MSI. (E) Relationships between risk score and TMB. (F, G) The waterfall plot of somatic mutation landscape between two risk groups, ranked by top 20 frequently mutated genes.

