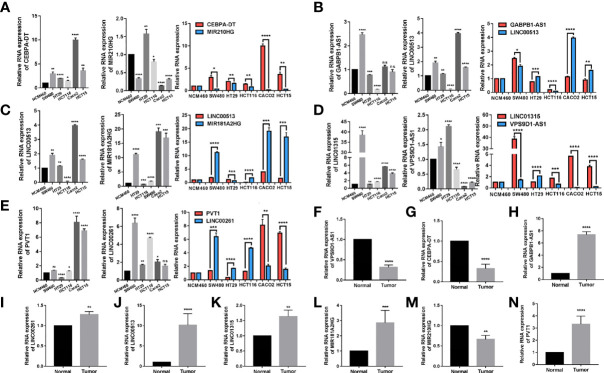
Figure 9.
qRT-PCR validation of lncRNA expression levels in different tissues and cell lines. The expression levels of (A) CEBPA-DTM|R210HG, (B) GABPB1-AS1|LINC00513, (C) LINC00513|MIR181A2HG, (D). LINC01315|VPS9D1-AS1 and (E) PVT1|LINC00261 in different cell lines (NCM460, SW480, Caco2, HCT15, HCT116, and HT29) were measured. (F–N) The expression levels of these lncRNAs in patients of colon cancer and their adjacent normal tissues (N=4) were measured. Results were normalized to reference gene GAPDH. (*P < 0.05, **P < 0.01, ***P < 0.001, ****p < 0.0001; ns, not significant).

