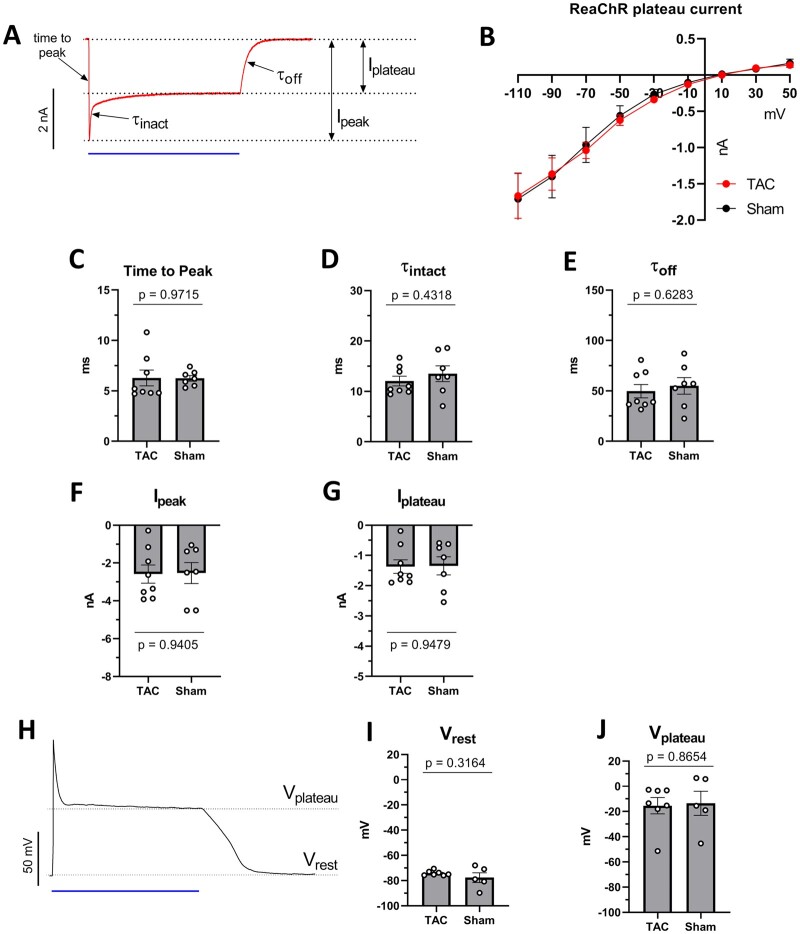
Figure 2.
Electrophysiological characterization of ReaChR photocurrents and membrane response in ventricular cardiomyocytes derived from TAC and sham-operated animals. In all voltage- and current-clamp experiments, ReaChR was activated by 470-nm light (1 s, 10 mW/mm2). (A) Representative whole-cell voltage clamp recording of ReaChR photocurrents from an isolated TAC cardiomyocyte. The membrane potential was clamped at −90 mV. Ipeak: maximal current amplitude, Iplateau: current amplitude at the end of the illumination period, time-to-peak: the length of the time interval between the beginning of illumination and the appearance of Ipeak, τinact: half-decay time of current decay from Ipeak to Iplateau, τoff: half-decay time of current decay from Iplateau to zero current. (B) ReaChR Iplateau amplitudes observed at a range of holding potentials between −110 and 50 mV. (C) Time-to-peak values of ReaChR current representing activation kinetics of ReaChR. (D) τinact values of ReaChR current representing ReaChR inactivation kinetics. (E) τoff time constant representing ReaChR closing kinetics. (F and G) ReaChR Ipeak (F) and Iplateau (G) amplitudes measured at −90 mV holding potentials. (H) Representative membrane potential response to 470 nm illumination (blue bar) recorded under current-clamp conditions in a cardiomyocyte isolated from a TAC animal. (I) Resting membrane potentials (Vrest) observed before illumination. (J) Plateau potentials (Vplateau) measured at the end of the 1 s light pulse. Each dot represents the results of an individual cell. For (C–H), n = 8 cells from four hearts in the TAC group and n = 7 cells from two hearts in the sham group. For (I) and (J), n = 7 cells from four hearts in the TAC group and n = 5 cells from two hearts in the sham group. Numerical data are represented as mean ± SEM, all P-values were calculated by the Student’s t-test.

