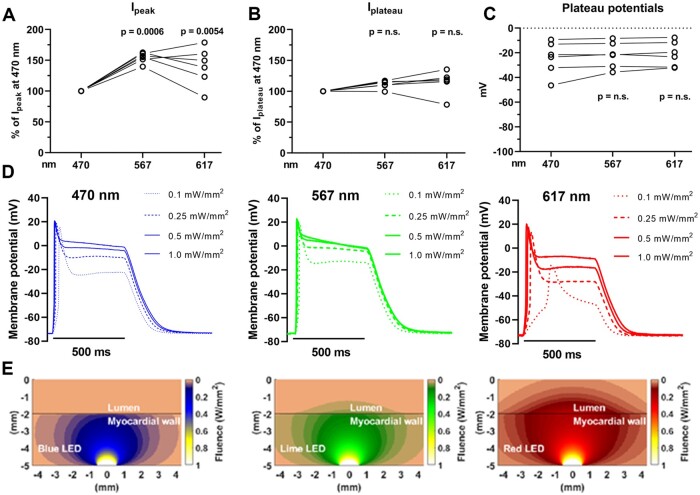
Figure 3.
Whole-cell patch clamp and sharp electrode measurements of ReaChR photocurrents and membrane potential responses, and computational light penetration simulations at different excitation wavelengths. (A and B) Relative ReaChR Ipeak (A) and Iplateau (B) amplitudes measured at −90 mV holding potentials upon illumination with 567 or 617 nm light compared to 470 nm light as the index (500 ms, 1 mW/mm2). Each dot represents the paired results of an individual cell (n=6 cells from four hearts). For the light pulses of 470 nm, the single dots represent averaged values. (C) ReaChR plateau potentials (Vplateau) measured at the end of a 500 ms light pulse (1 mW/mm2) for 470, 567, and 617 nm light. Each dot represents the results of an individual cell (n=6 cells from four hearts). (D) Representative sharp electrode measurements of a ReaChR-expressing ventricular tissue sample from a TAC rat showing sustained depolarization illumination for 500 ms with blue (λ=470 nm), lime (λ=567 nm), or red (λ=617 nm) light of various intensities. All recordings are from the same ventricular spot. (E) Computational simulations of propagation of 470, 567, and 617 nm light through rat myocardium.

