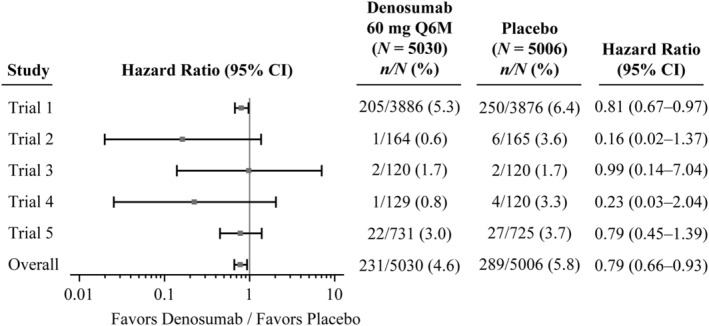
Figure 1.

Forest plot of time to first occurrence of fall according to individual studies and the overall. N = number of subjects who received at least one dose of investigational product in trial 1 (placebo‐controlled 36 months), trial 2 (placebo‐controlled only first 24 months), trial 3 (placebo‐controlled only first 12 months), trial 4 (placebo‐controlled only first 24 months), trial 5 (placebo‐controlled only first 36 months). Hazard ratio and 95% CIs are based on Cox proportional hazards model; overall estimates are based on Cox proportional hazards model stratified by study. Q6M = every 6 months.
