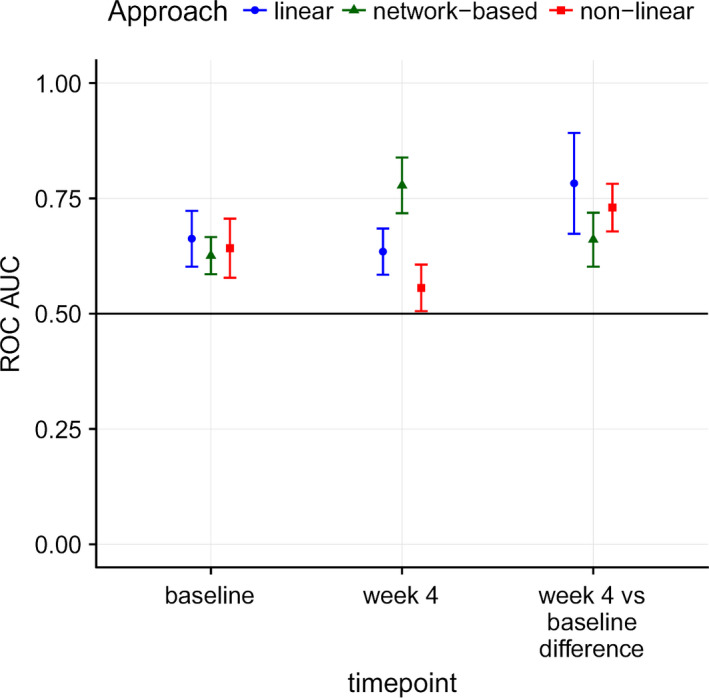
Figure 1.

Performance of statistical machine learning models to distinguish therapeutic nonresponders from responders (assessed at 6 months) using gene expression data at pretreatment and 4 weeks after treatment initiation, and using the ratio of gene expression (i.e., the difference in log2‐transformed transcript expression intensity between 4 weeks of treatment and pretreatment). Area under the receiver operating characteristic (ROC) curves (AUCs) were calculated for estimating the predicted performance of a linear method (regularized logistic regression), a nonlinear method (random forest), and a network‐based approach to evaluating methotrexate nonresponse in patients with rheumatoid arthritis. Results are the mean ± SEM.
