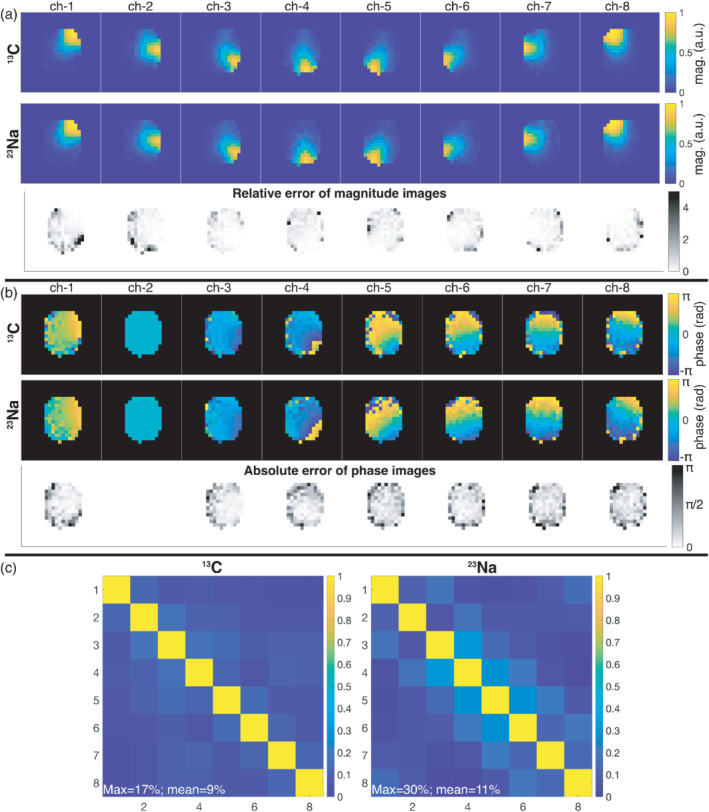
FIGURE 3.

Single‐slice measured coil profiles of the individual array channels for 13C and 23Na. A, Magnitude images and their relative error. B, Phase images and their absolute error (referenced to the phase of channel 2). C, 13C and 23Na noise correlation matrices. The noise covariances (normalized to the maximum variance) for 13C were: 0.75, 0.75, 0.83, 0.99, 0.80, 0.66, 0.91, 1.00. For 23Na, the (normalized) noise covariance were: 0.83, 0.65, 0.77, 0.94, 0.86, 0.60, 0.95, 1.00
