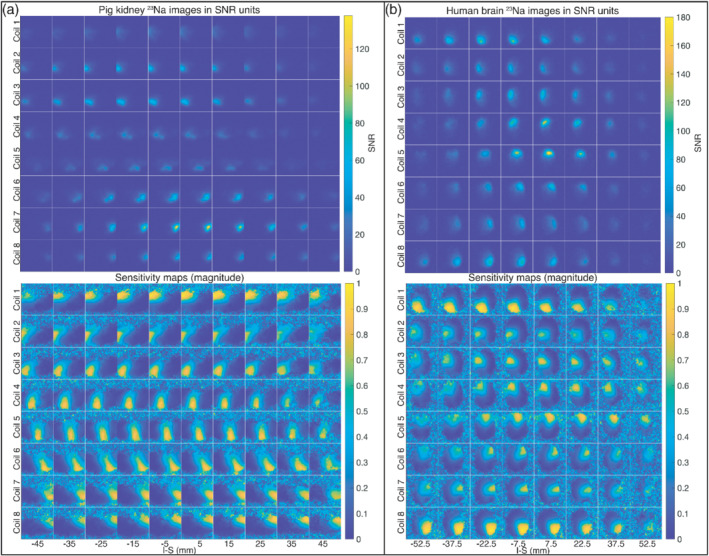
FIGURE 7.

3D 23Na SNR images (top) and final magnitude coil sensitivity maps (bottom): for the abdomen of the healthy pig (A), and for the head of the healthy human volunteer (B). The images are shown for axial slices from left to right and coil channels from top to bottom
