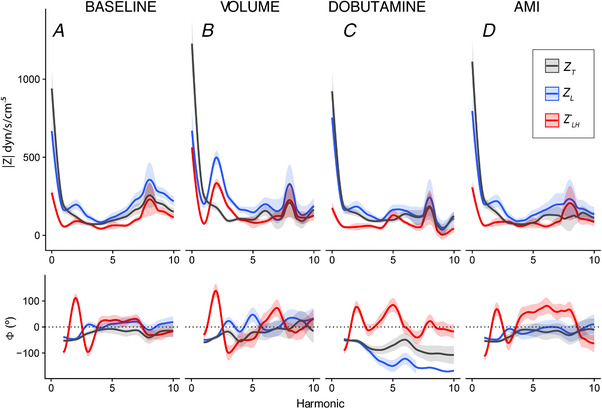
Figure 3. Frequency domain analyses.

Solid lines show the least squares means and the ribbon shows their SE. Moduli () is shown in the top row whereas the bottom row shows the phase (ϕ). Results are shown for the baseline (A) (n = 18 animals), volume (B) (n = 6), dobutamine (C) (n = 8) and AMI (D) (n = 8) phases. Pulmonary input impedance (Z T) is shown in black and longitudinal impedance of the pulmonary vessels (Z L) is shown in blue, whereas the harmonic spectra impedance of the periodical time‐varying system of the LH () is shown in red. Note that, for most harmonics, Z T is below Z L, demonstrating a favourable effect of the harmonic response of the LH on Z T. [Color figure can be viewed at wileyonlinelibrary.com]
