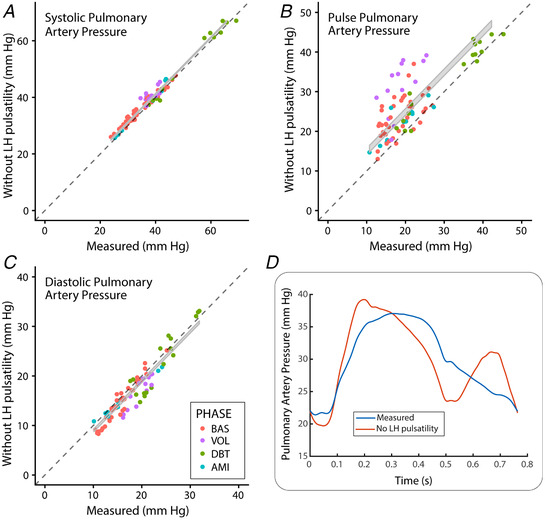
Figure 4. Effects of the harmonic response of the LH on pulmonary artery pressures for pooled data (n = 18).

A and C, results for systolic and diastolic pressures, respectively. B, pulse pressure. Measured pressures are shown on the horizontal axes, whereas values obtained if the LH had no harmonic response are shown on the vertical axes. The grey ribbon shows the 95% confidence interval of the paired t test difference. D, waveforms obtained in a representative example. [Color figure can be viewed at wileyonlinelibrary.com]
