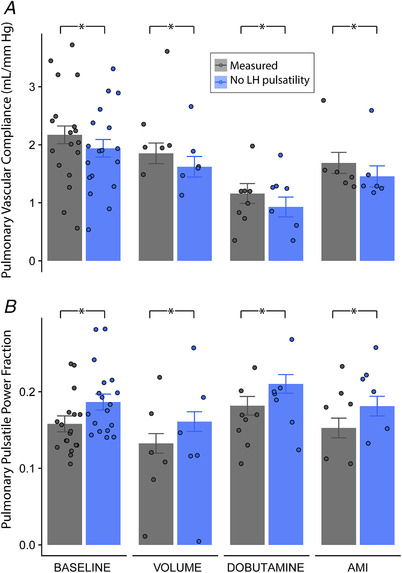
Figure 5. Impact of the harmonic response of the LH.

(A) Impact on pulmonary vascular compliance and (B) impact on pulmonary pulsatile power fraction at baseline, volume overload, dobutamine infusion and AMI phases (n = 18 animals). Bars show least squares mean estimates and their SE, whereas scattered dots show individual data. Measured values (grey) are compared with the theoretical values that would be obtained in the presence of a pure resistive LH (blue) by pairwise contrasts in the linear mixed models accounting for repeated measures. [Color figure can be viewed at wileyonlinelibrary.com]
