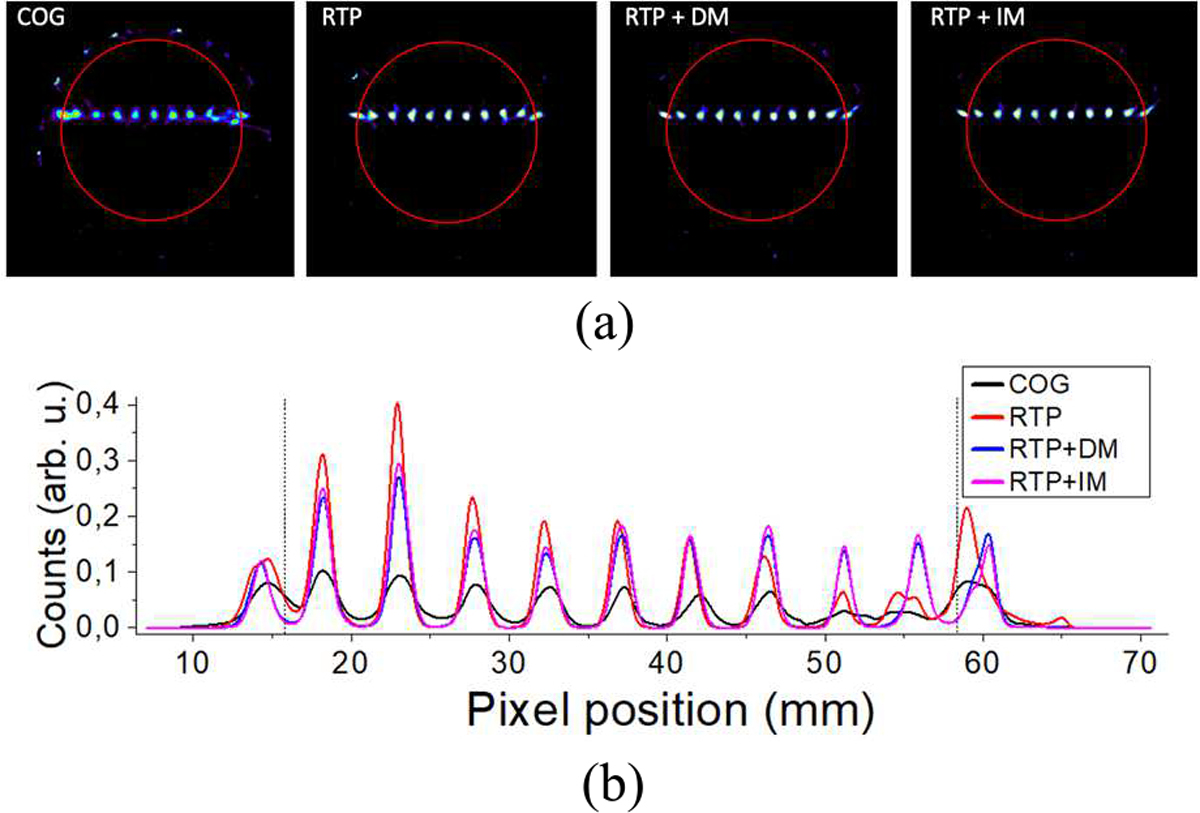
Fig. 11.

Analysis of the reconstructed array (a) from left to right: COG, RTP, RTP + DM, and RTP + IM, respectively. The red circle shows the limit of the calibration normalization, and (b) projections of the central row of the coronal view of sources for all cases.
