Fig. 12.

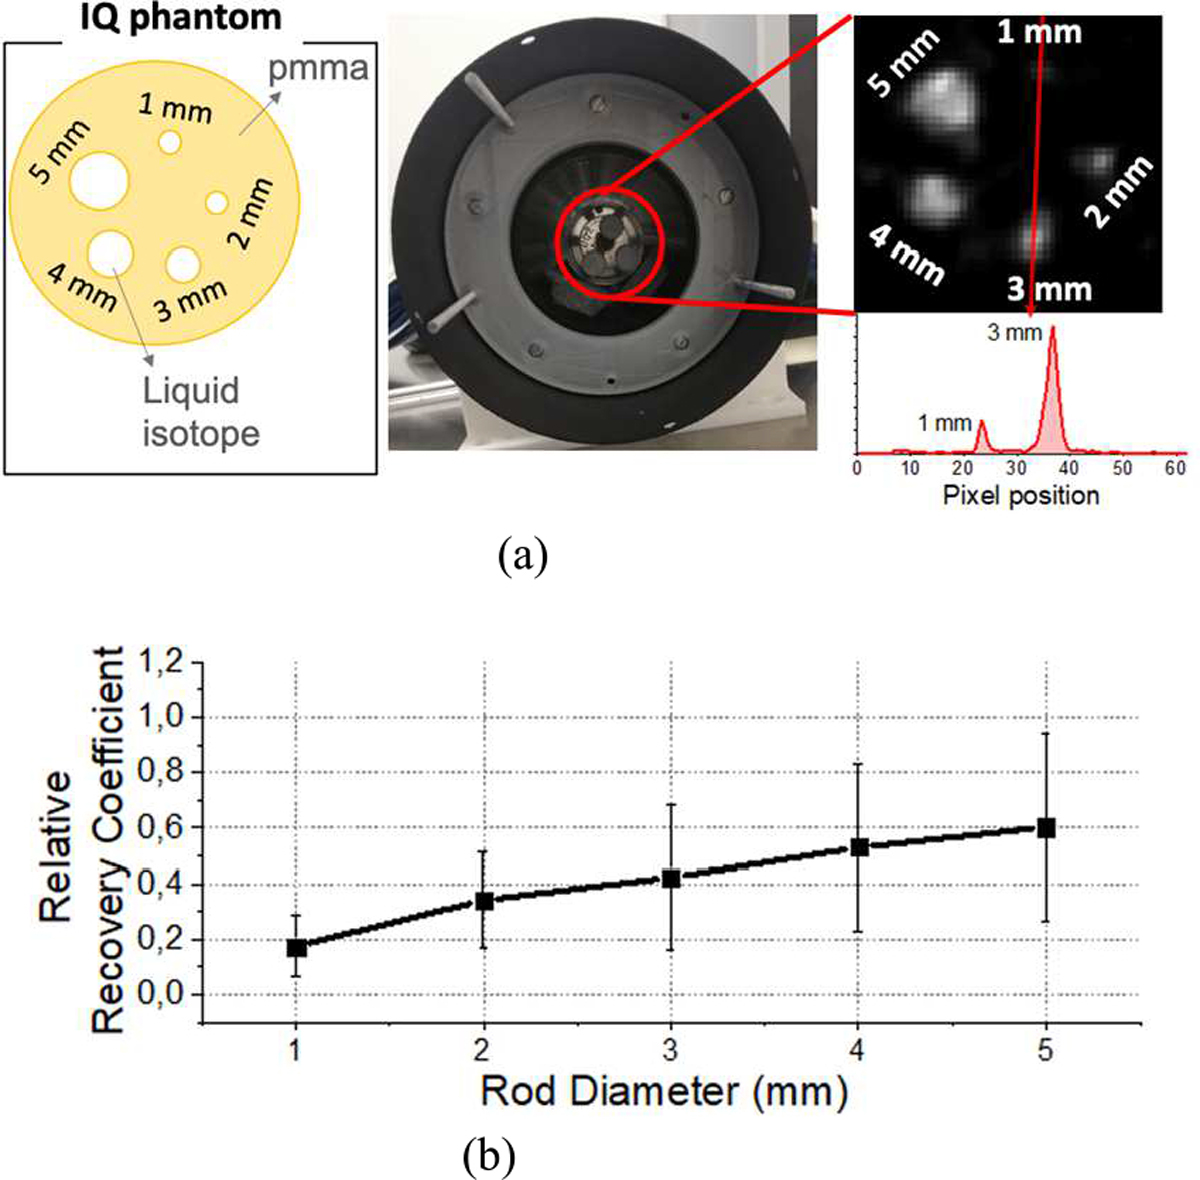
(a) Photograph of the system including the IQ phantom and reconstructed image of the rods showing the profiles across the 1 and 3 mm rods, and (b) measured relative recovery coefficient values.

(a) Photograph of the system including the IQ phantom and reconstructed image of the rods showing the profiles across the 1 and 3 mm rods, and (b) measured relative recovery coefficient values.